Trajectory Analysis Of Single Cell RNAseq Data Suggest Intrarenal Induction Of Tregs In Spontaneously Accepted Kidney Allografts
1Department of Surgery, Center for Transplantation Sciences, Massachusetts General Hospital, Boston, MA, 2Department of Surgery, Boston Children's Hospital, Boston, MA, 3Department of Pathology, Center for Transplantation Sciences, Massachusetts General Hospital, Boston, MA
Meeting: 2022 American Transplant Congress
Abstract number: 9024
Keywords: Gene expression, Kidney/liver transplantation, T cells, Tolerance
Topic: Basic Science » Basic Science » 10 - Treg/Other Regulatory Cell/Tolerance
Session Information
Session Name: Late Breaking: Basic / Translational
Session Type: Rapid Fire Oral Abstract
Date: Monday, June 6, 2022
Session Time: 3:30pm-5:00pm
 Presentation Time: 3:50pm-4:00pm
Location: Hynes Room 313
*Purpose: Kidney allografts transplanted across certain mouse strain combinations (e.g. DBA/2 to B6) are spontaneously accepted independent of the recipient’s thymus, spleen, and lymph nodes. We have recently shown that novel regulatory Tertiary Lymphoid Organs (rTLOs) form within accepted renal allografts and are made up of a diverse population of immune cells that aggregate within these structures, including T cells. Here, we characterize the T cell development within rTLOs at the single-cell level via Trajectory Analysis using scRNA-sequencing data.
*Methods: We performed life-sustaining DBA/2 to B6 kidney transplants. At 1 week (n=3), 3 weeks (n=5), and 24 weeks (n=3), transplanted kidneys were harvested, converted to single cells, sorted for CD45+, and analyzed by scRNAseq. The cDNA libraries underwent Next Generation Sequencing and the data was analyzed using the Seurat software package and Monocle 3 in RStudio. Utilization of Monocle 3 allowed trajectory analysis of T cells in transplanted allografts.
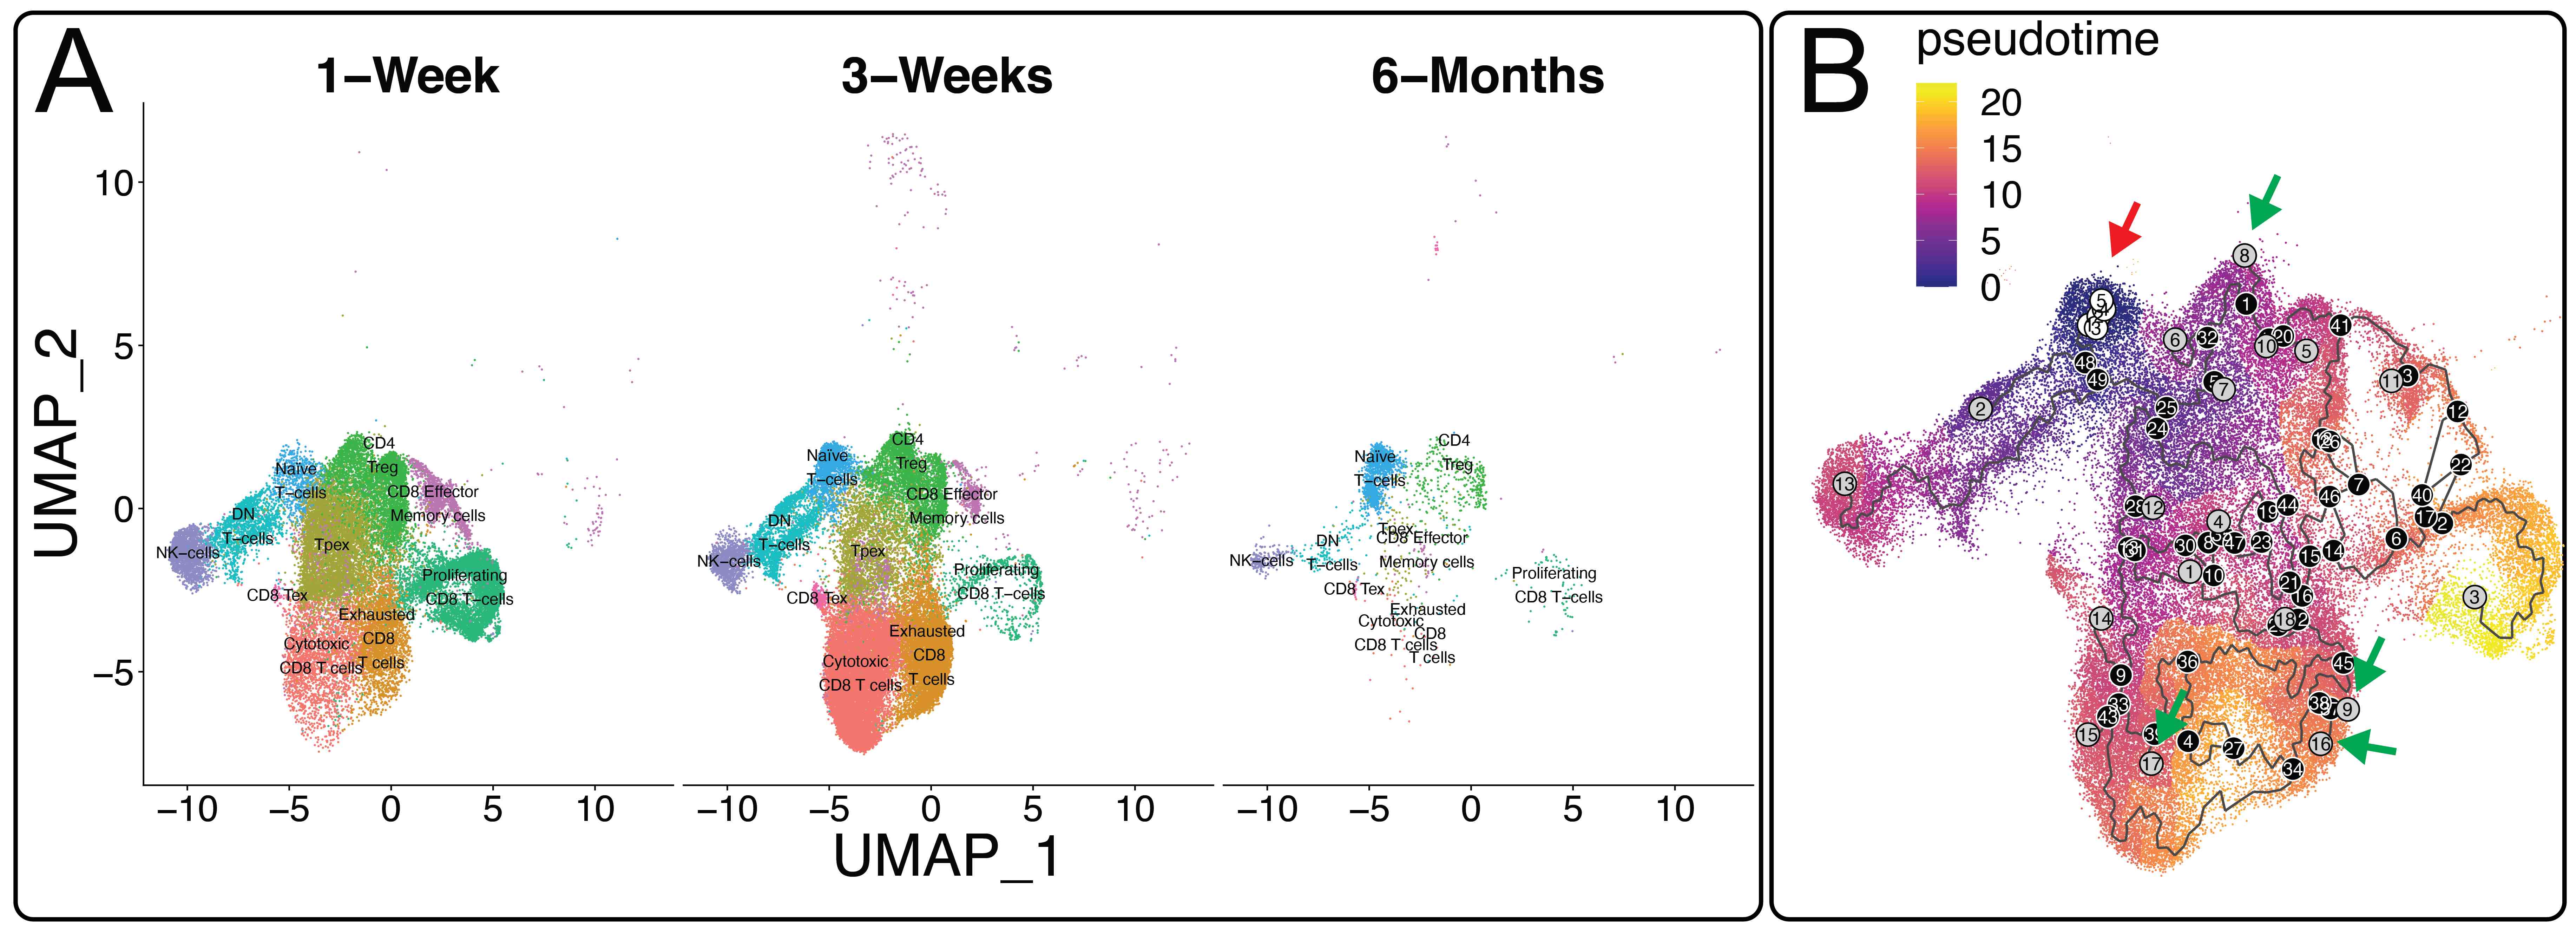
*Results: The T cell signature appeared as early as 1-week post-transplantation. More specifically, we found 10 unique T cell clusters that changed over time including naïve T cells, CD4 Tregs, and cytotoxic T cells. Trajectory analysis using naïve T cells (white circles, red arrow) as a starting point go through multiple transitions (black lines as trajectory paths and black circles as branch points) within the kidney, with several terminations in a variety of sub-type T cells including CD4 Tregs, cytotoxic CD8 T cells that begin to express two regulatory genes for Fgl2 and CD122, and exhausted CD8 T cells (gray circles are termination points, green arrows).
*Conclusions: Our gene expression data suggest that the T cell signature in accepted kidneys maintains a high percentage of naïve T cells over time and that CD4 Treg cells are formed within the transplanted allografts. The reprogramming of T cells within allografts (versus peripherally) into CD4 Tregs may be an important mechanism in the induction and maintenance of spontaneous allograft tolerance.
Figure 1. (A) RNA-Sequencing UMAP of allografts over time illustrating T cell populations. (B) Trajectory Analysis of T cells starting with naive cells.
To cite this abstract in AMA style:
Guinn M, Szuter ES, Yokose T, Ge J, Kwon B, Rosales I, Russell PS, Cuenca A, Madsen J, Colvin R, Alessandrini A. Trajectory Analysis Of Single Cell RNAseq Data Suggest Intrarenal Induction Of Tregs In Spontaneously Accepted Kidney Allografts [abstract]. Am J Transplant. 2022; 22 (suppl 3). https://atcmeetingabstracts.com/abstract/trajectory-analysis-of-single-cell-rnaseq-data-suggest-intrarenal-induction-of-tregs-in-spontaneously-accepted-kidney-allografts/. Accessed January 10, 2026.« Back to 2022 American Transplant Congress

