Role of Serial Donor Derived Cell-Free DNA Monitoring in Kidney Transplant Recipients
Nephrology, Stanford University School of Medicine, Palo Alto, CA
Meeting: 2021 American Transplant Congress
Abstract number: 893
Keywords: Biopsy, Graft function, Monitoring, Rejection
Topic: Clinical Science » Kidney » Kidney: Acute Cellular Rejection
Session Information
Session Name: Kidney: Acute Cellular Rejection
Session Type: Poster Abstract
Session Date & Time: None. Available on demand.
Location: Virtual
*Purpose: Donor derived cell-free DNA (dd cf-DNA; Allosure, CareDx) is increasingly employed for non-invasive kidney transplant monitoring. The goal of this study was 1) to examine the association between dd cf-DNA and for-cause biopsy findings and 2) describe changes in dd cf-DNA and creatinine following rejection treatment.
*Methods: We included patients who 1) received a kidney transplant between May 2017 and July 2020 at our center, 2) underwent for-cause kidney transplant biopsy, 3) had ≥ 1 dd cf-DNA prior to biopsy and 4) had ≥ 2 dd cf-DNA levels measured during the entire study period. Patient demographic and clinical data were abstracted from medical records.
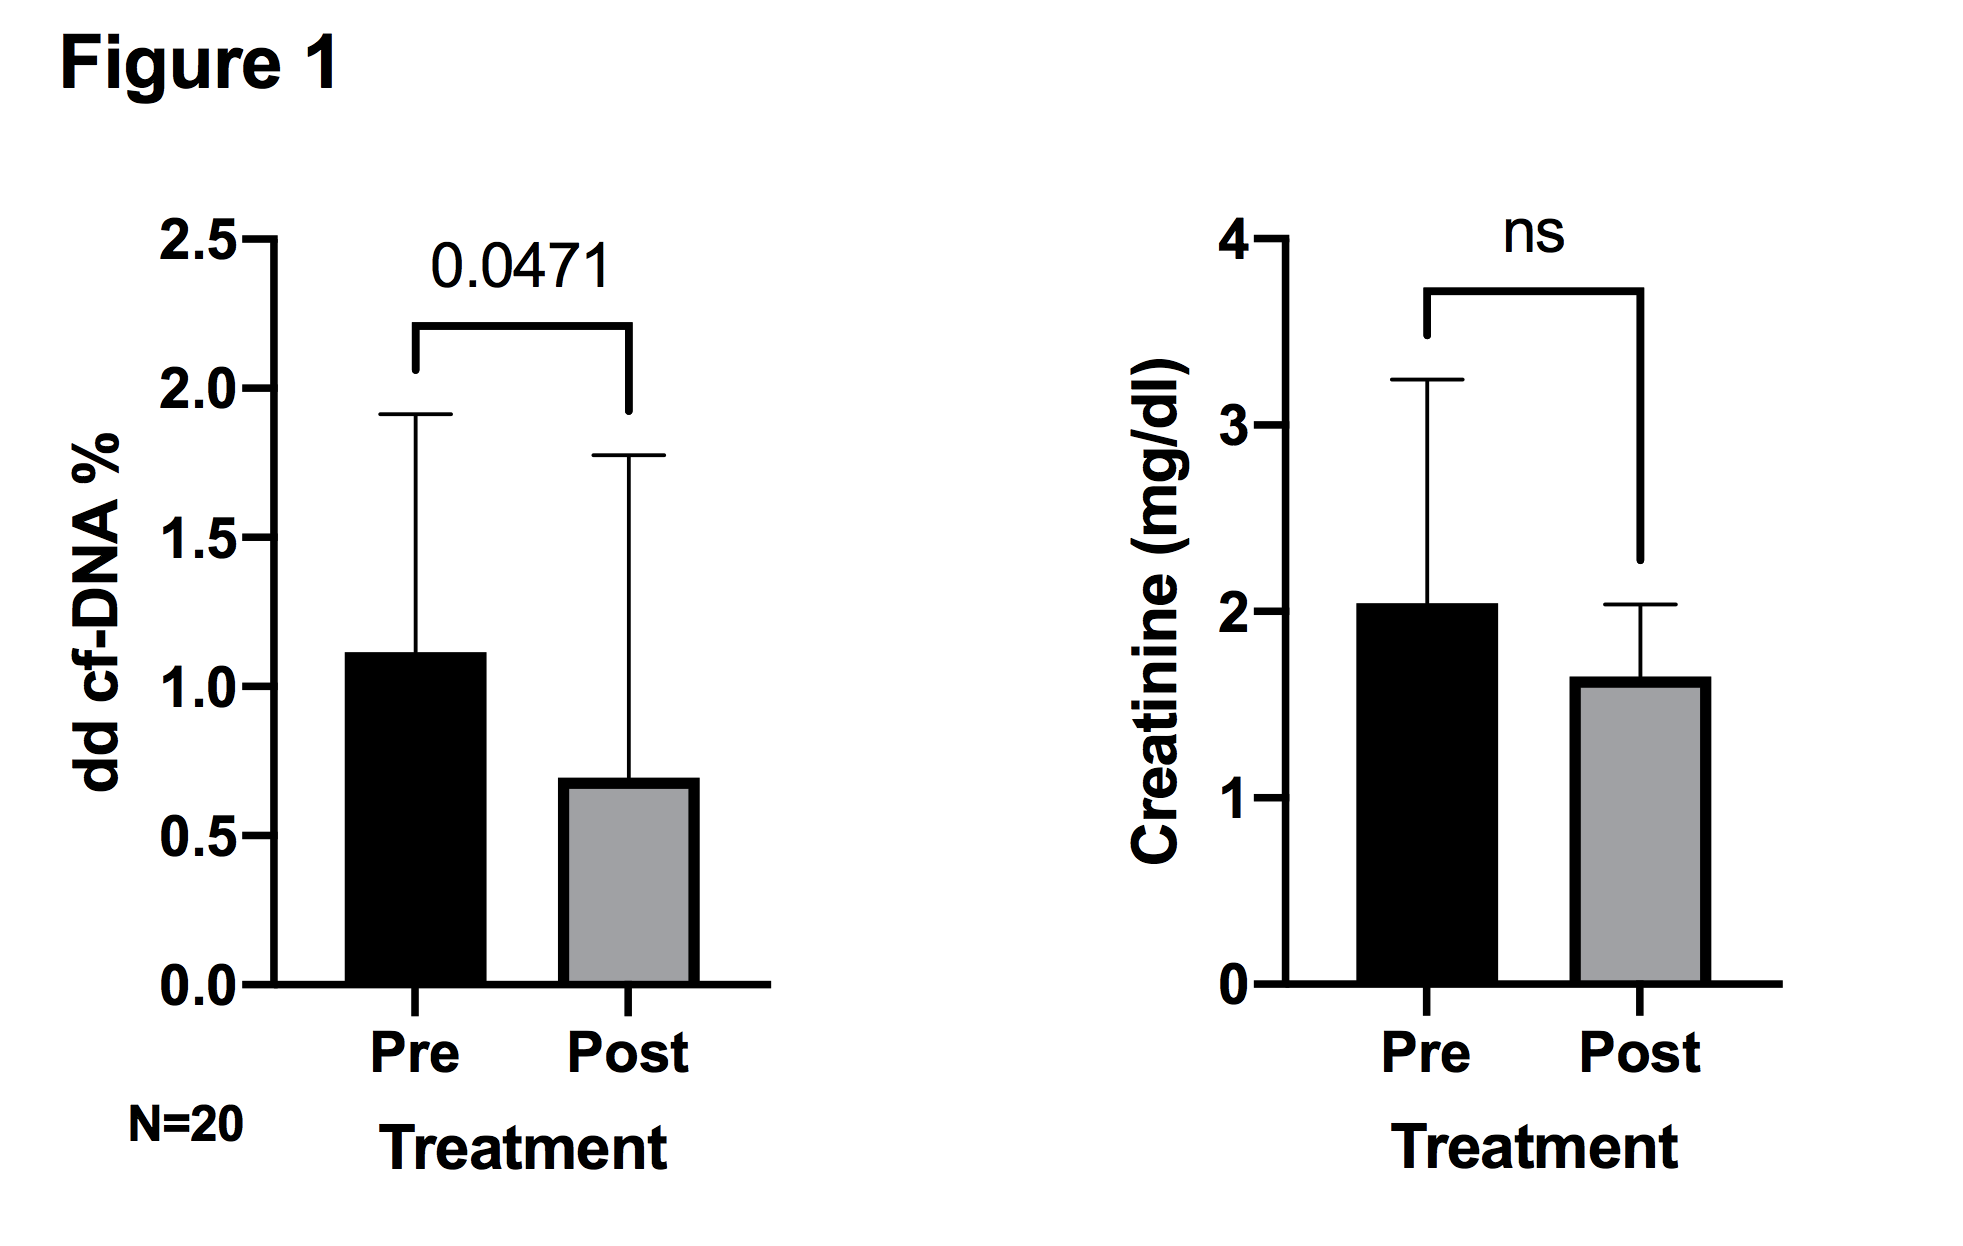
*Results: 41 patients were stratified into 4 groups based on their most recent pre-biopsy dd cf-DNA: >1.0% (Group 1), 0.50-0.99% (Group 2), 0.21-0.49% (Group 3), and <0.21% (Group 4). Baseline characteristics are shown in table 1. The prevalence of rejection was greatest in the highest dd cf-DNA stratum (Group 1) and decreased across the 4 dd cf-DNA strata (table 2). Severe rejection (per Banff Criteria) was seen more frequently in Group 1. Only 1 patient (out of 11) in the lowest dd cf-DNA stratum (Group 4) had rejection and that was a ‘borderline’ T cell mediated rejection diagnosed on a background of prominent tubular injury and delayed graft function. Nearly all patients had a decrease in dd cf-DNA after treatment of rejection. Post-rejection decrease in creatinine (measured at the same time as dd cf-DNA) was less pronounced (figure 1).
*Conclusions: Our study suggests that kidney transplant recipients with low dd cf-DNA (<0.21%) who undergo for-cause biopsy are unlikely to have rejection. Monitoring of dd cf-DNA may prove useful in assessing response to rejection treatment.
| Group 1: dd cf-DNA >1.0% (N = 12) |
Group 2: dd cf-DNA 0.50-0.99% (N=7) | Group 3: dd cf-DNA 0.21-0.49% (N=11) | Group 4: dd cf-DNA<0.21% (N=11) | |
| Median dd cf-DNA (IQR) | 1.85 (1.25 – 2.93) | 0.90 (0.83 – 0.97) | 0.38 (0.26 – 0.43) | 0.15 (0.13 – 0.18) |
| Median Cr (IQR) | 1.45 (1.14 – 2.37) | 1.56 (1.02 – 1.83) | 1.76 (1.45 – 2.54) | 1.43 (1.11 – 1.99) |
| Median cPRA % (IQR) | 89 (30 – 100) | 75 (6 – 97) | 69 (27 – 99) | 45 (0 – 89) |
| Median HLA Mismatch #/14 (IQR) | 8 (6 – 11) | 6 (6 – 11) | 8 (5 – 11) | 8 (7 – 9) |
| Living donor (%) | 5 (35.7) | 3 (42.9) | 1 (9.1) | 2 (18.2) |
| Median KDPI % (IQR) | 28 (22 – 32) | 39 (21 – 69) | 49 (20 – 71) | 41 (10 – 69) |
| Median days between dd cf-DNA and biopsy (IQR) | 18 (1 – 43) | 16 (10 – 53) | 5 (4 – 22) | 32 (8 – 92) |
| Group 1: dd cf-DNA >1.0% (N=12) | Group 2: dd cf-DNA 0.50-0.99% (N=7) | Group 3: dd cf-DNA 0.21-0.49% (N=11) | Group 4: dd cf-DNA <0.21% (N=11) | P-Value | |
| All rejections (%) | 9 (75.0) | 5 (71.4) | 5 (45.5) | 1 (9.1) | 0.008 |
| Rejections excluding borderline (%) | 6 (50.0) | 2 (28.6) | 2 (18.2) | 0 | 0.04 |
| All TCMR | 8 | 5 | 5 | 1 | |
| Borderline TCMR | 2 | 3 | 3 | 1 | |
| ABMR (*including mixed rejections) | 3* | 2* | 0 | 0 | |
| % Change in dd cf-DNA after treatment | -63.3 | -67.4 | -50.0 | 0 | |
| % Change in Cr after treatment | +6.7 | -4.5 | -9.6 | 0 |
To cite this abstract in AMA style:
Wang AX, Lenihan CR. Role of Serial Donor Derived Cell-Free DNA Monitoring in Kidney Transplant Recipients [abstract]. Am J Transplant. 2021; 21 (suppl 3). https://atcmeetingabstracts.com/abstract/role-of-serial-donor-derived-cell-free-dna-monitoring-in-kidney-transplant-recipients/. Accessed February 18, 2026.« Back to 2021 American Transplant Congress

