MELD is MELD is MELD? Geographic/ Center-Level Variation in Mortality for Patients with the Same MELD Score
1Johns Hopkins University, Baltimore, MD, 2Department of Mathematics, United States Naval Academy, Annapolis, MD
Meeting: 2020 American Transplant Congress
Abstract number: 578
Keywords: Liver transplantation, Mortality, Multicenter studies, Waiting lists
Session Information
Session Name: Liver: MELD, Allocation and Donor Issues (DCD/ECD) II
Session Type: Oral Abstract Session
Date: Saturday, May 30, 2020
Session Time: 3:15pm-4:45pm
 Presentation Time: 3:51pm-4:03pm
Location: Virtual
*Purpose: Waitlist candidates living in areas with poor access to health care may have higher mortality risk compared to candidates with same MELD in other areas. Therefore, MELD may underestimate mortality at transplant centers in areas with poor access to health care, and MELD-based allocation would disadvantage centers serving these candidates. Our study aimed to investigate the center level variation in mortality rate among candidates with similar MELD.
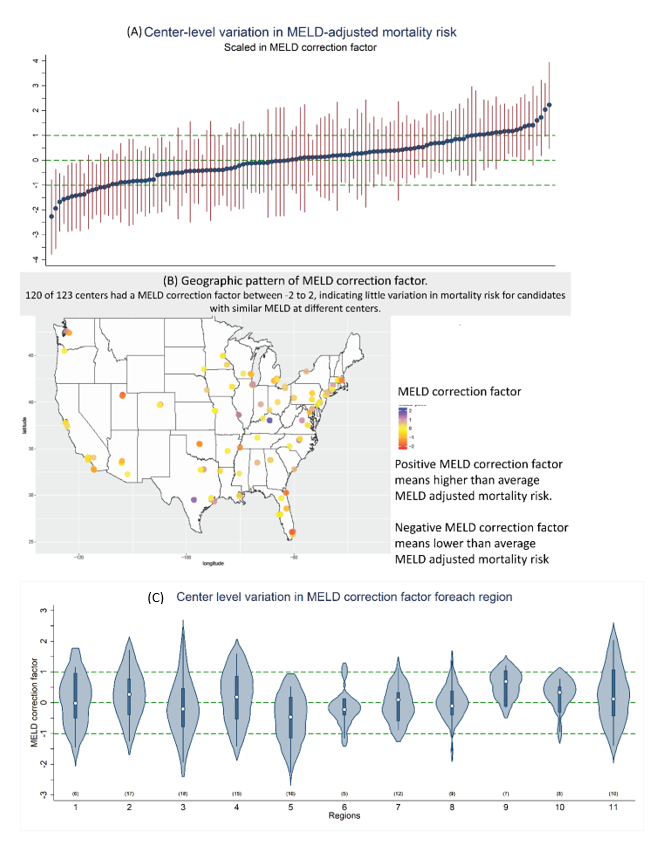
*Methods: Using SRTR data 1/2013-6/2017, we modeled mortality risk in 44,528 adult, first-time active liver waitlist candidates from 123 transplant centers using multilevel Poisson regression adjusting for age, sex, race/ethnicity, and MELD score. For each center, we calculated a “MELD correction factor” based on the center-level random intercept and the coefficient for MELD. A MELD correction factor of +1 would mean that candidates at that center have higher than average MELD-adjusted mortality risk, at a level equivalent to 1 MELD points (e.g. candidates with MELD of 17 at that center have risk equivalent to MELD of 18 elsewhere). We plotted MELD correction factors using a caterpillar plot to show the center level variation in MELD adjusted mortality risk. To describe the geographic pattern, we plotted MELD correction factors for transplant centers in color-scaled maps. We used violin plot to show the distribution of MELD correction factors for different regions.
*Results: Median (IQR) MELD correction factor for the 123 centers was 0.08 (-0.51, 0.59), indicating only mild center-level variation. Only 15 of 123 centers had a MELD correction factor less than -1.0 and 19 of 123 centers had a MELD correction factor greater than 1.0 (Figure, (A)). Negative MELD correction factor indicates that patients at that center have lower than average MELD-adjusted mortality risk. There was no clear geographic pattern of MELD correction factors (Figure, (B)). Distribution of MELD correction factor was consistent across regions (Figure, (C)).
*Conclusions: There was little center-level variation in mortality risk for candidates with similar MELD. Our results indicate that MELD-based allocation does not penalize or favor some transplant centers over others, or systematically advantage or disadvantage any region.
To cite this abstract in AMA style:
Ishaque T, Massie AB, Kernodle AB, Getsin S, Chaing P, Gentry S, Segev D. MELD is MELD is MELD? Geographic/ Center-Level Variation in Mortality for Patients with the Same MELD Score [abstract]. Am J Transplant. 2020; 20 (suppl 3). https://atcmeetingabstracts.com/abstract/meld-is-meld-is-meld-geographic-center-level-variation-in-mortality-for-patients-with-the-same-meld-score/. Accessed February 23, 2026.« Back to 2020 American Transplant Congress

