Liver Transplant Outcomes Across the Age Distribution and Interactions with County Health
1Psychiatry & Psychology
Transplantation, Mayo Clinic, Jacksonville, FL, 2Health Sciences Research, Mayo Clinic, Jacksonville, FL, 3Heath Sciences Research, Mayo Clinic, Jacksonville, FL, 4Psychiatry & Psychology, Mayo Clinic, Rochester, MN, 5Transplantation, Mayo Clinic, Jacksonville, FL, 6Psychiatry & Psychology, Mayo Clinic, Jacksonville, FL
Meeting: 2020 American Transplant Congress
Abstract number: 436
Keywords: Age factors, Liver, Outcome, Public policy
Session Information
Session Name: All Organs: Public Policy & Allocation
Session Type: Oral Abstract Session
Date: Saturday, May 30, 2020
Session Time: 3:15pm-4:45pm
 Presentation Time: 3:27pm-3:39pm
Location: Virtual
*Purpose: We examined risk of graft failure and patient mortality after liver transplant (LT) across the age continuum and county Health Outcomes & Health Factors ranks.
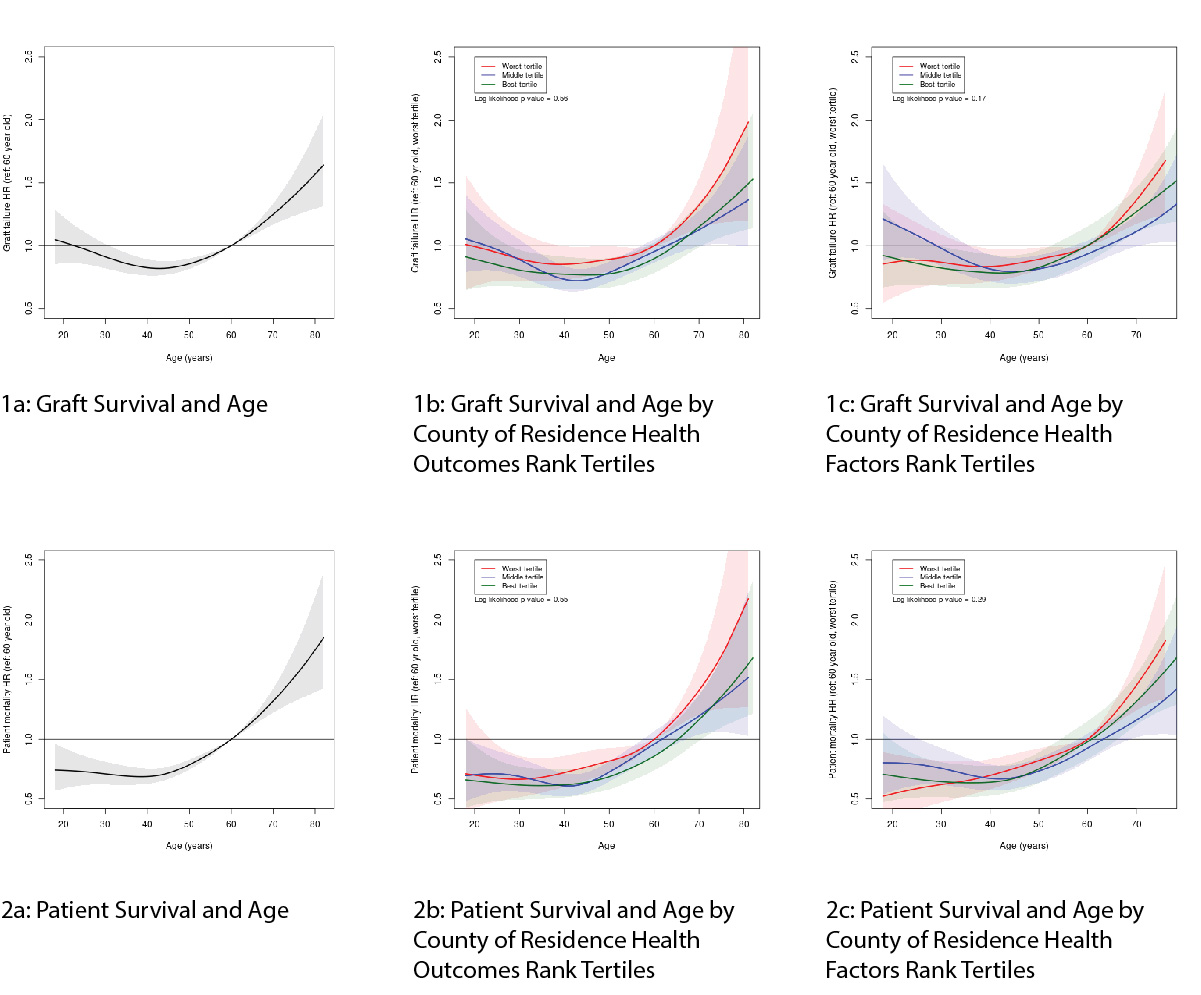
*Methods: UNOS Standard Transplant Analysis & Research file and national County Health Ranking (CHR) data were linked by LT recipient zip code. CHR scores were calculated for 3149 US counties for 8 consecutive years. Average CHR scores were used to create a nationwide rank order list and divided into best, middle and worst tertiles. Adults transplanted between Jan 2010 and June 2018 were included. Analysis included mixed effects Cox proportional hazards models, adjusted for relevant patient, donor, and county characteristics. Flexible hazard ratio (HR) curves were created to examine the association of age at LT with graft & patient survival. The interactions of age and county Health Outcomes and Health Factors ranks were examined for graft & patient survival using HR curves and log likelihood tests.
*Results: Among the 46,120 LTs in the analysis, the median recipient age at LT was 58 years and median follow-up was 2.2 years. Graft and patient survival showed similar trends across the age distribution, with risk of graft failure and patient mortality increasing gradually after approximately age 45. Hazard ratios and 95% confidence intervals (CI) for graft failure at ages 20, 30, 40, 50, 70, and 80 respectively (compared to age 60) are: 1.03 (0.86, 1.23), 0.91 (0.82, 1.01), 0.82 (0.76, 0.89), 0.86 (0.82, 0.90), 1.25 (1.17, 1.33), 1.57 (1.29, 1.90). Hazard ratios and 95% CI for patient mortality at the same ages are: 0.74 (0.59, 0.93), 0.71 (0.62, 0.81), 0.69 (0.63, 0.76), 0.79 (0.75, 0.83), 1.32 (1.22, 1.42), 1.75 (1.39, 2.19). In log likelihood tests comparing models with and without interactions between age and both county Health Outcomes and Health Factors rank tertiles, models including the interactions were not significantly better than models without them.
*Conclusions: Patient survival gradually decreases with age whereas graft failure demonstrates a U-shaped relationship: those around age 20 and those over 60 are at greater risk of graft failure. Outcomes across the age distribution by the county Health Outcomes and Health Factors Rank tertiles varied but were not statistically significant.
To cite this abstract in AMA style:
Niazi SK, Vargas E, Spaulding A, Crook J, Schneekloth T, Keaveny A, Vasquez A, Gentry M, Rummans T, Taner C. Liver Transplant Outcomes Across the Age Distribution and Interactions with County Health [abstract]. Am J Transplant. 2020; 20 (suppl 3). https://atcmeetingabstracts.com/abstract/liver-transplant-outcomes-across-the-age-distribution-and-interactions-with-county-health/. Accessed February 5, 2026.« Back to 2020 American Transplant Congress

