Is There a Difference Between DCD and DBD Kidney Transplantation with Similar KDPI?
T. Zens, G. Leverson, R. Redfield, P. Chlebeck, L. Zitur, D. Kaufman, L. Fernandez.
Surgery, University of Wisconsin, Madison, WI.
Meeting: 2016 American Transplant Congress
Abstract number: B188
Keywords: Donors, Graft failure, Graft function, Outcome, unrelated
Session Information
Session Name: Poster Session B: Kidney Transplantation: KDPI, HCV/Matching, Donor Age
Session Type: Poster Session
Date: Sunday, June 12, 2016
Session Time: 6:00pm-7:00pm
 Presentation Time: 6:00pm-7:00pm
Location: Halls C&D
Introduction: Renal transplant outcomes are a result of a combination of donor and recipient factors. In 2014, the nomenclature used to describe donor quality was changed from extended criteria versus standard criteria to kidney donor profile index (KDPI). The aim of our study is to characterize differences in transplant outcomes for donor after cardiac death (DCD) and donor after brain death (DBD) transplants with similar KDPIs.
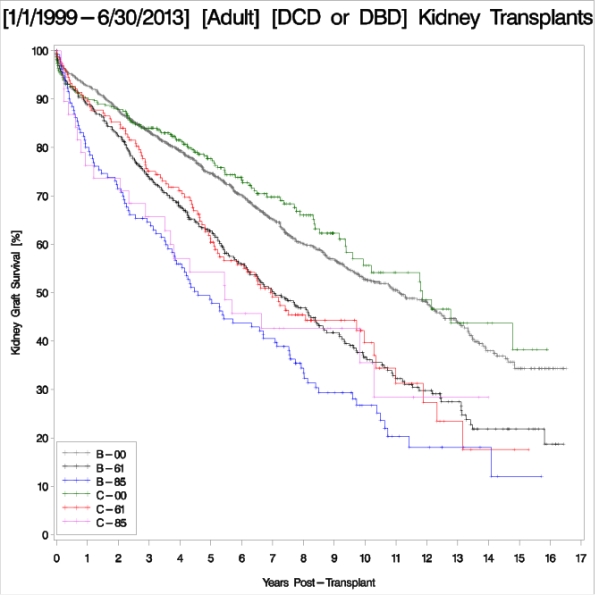
Methods: An single center retrospective chart review was performed from 1/1999-7/2013. 2161 kidney transplants were included. The patients were divided into 6 groups: DBD KDPI≤60, DBD KPDI 61-84, DBD KDPI≥85, DCD KDPI≤60, DCD KPDI 61-84, and DCD KDPI≥85. Rates of DGF, patient survival, and graft survival were examined.
Results: When examining all groups, rates of DGF increased with increasing KDPI and graft and patient survival decreased with increasing KDPI (p value <0.001). DCD kidneys had substantially higher rates of DGF than their DBD counterparts. There were no statistically significant differences between patient or graft survival when comparing DCD and DBD kidneys with equivalent KDPIs.
|
DBD KDPI 0-60 N=1118 |
DCD KDPI 0-60 N=328 |
P value | |
| DGF | 18.7% | 45.1% | <0.001 |
| Graft Survival at 5 yrs | 74.6% | 77.7% |
0.3170 |
| Patient Survival at 5 yrs | 85.8% | 86.4% |
0.6044 |
|
DBD KDPI 61-84 N=384 |
DCD KDPI 61-84 N=163 |
P value | |
| DGF | 29% | 49.1% | <0.001 |
| Graft Survival at 5 yrs | 62.7% | 61.1% |
0.9817 |
| Patient Survival at 5 yrs | 76.3% | 75.0% |
0.8178 |
|
DBD KDPI ≥ 85 N=130 |
DCD KDPI ≥ 85 N=38 |
P value | |
| DGF | 31.5% | 55.3% | 0.007 |
| Graft Survival at 5 yrs | 48.6% | 54.2% | 0.4079 |
| Patient Survival at 5 yrs | 63.4% | 59.5% | 0.9865 |

Conclusion: Increasing KDPI is a more powerful predictor of patient or graft survival than DCD versus DBD status given there are no differences between DBD and DCD kidneys with similar KDPIs. DCD status is the strongest factor contributing to the development of DGF. The new KDPI system is an accurate predictor of donor contributions to transplant outcomes as rates of DGF and graft failure increase with increasing KDPI in all patients.
CITATION INFORMATION: Zens T, Leverson G, Redfield R, Chlebeck P, Zitur L, Kaufman D, Fernandez L. Is There a Difference Between DCD and DBD Kidney Transplantation with Similar KDPI? Am J Transplant. 2016;16 (suppl 3).
To cite this abstract in AMA style:
Zens T, Leverson G, Redfield R, Chlebeck P, Zitur L, Kaufman D, Fernandez L. Is There a Difference Between DCD and DBD Kidney Transplantation with Similar KDPI? [abstract]. Am J Transplant. 2016; 16 (suppl 3). https://atcmeetingabstracts.com/abstract/is-there-a-difference-between-dcd-and-dbd-kidney-transplantation-with-similar-kdpi/. Accessed February 16, 2026.« Back to 2016 American Transplant Congress
