Change in Deceased Donor Demographics with Drug Intoxication Deaths: 2010 – 2019
SRTR, Minneapolis, MN
Meeting: 2021 American Transplant Congress
Abstract number: 459
Keywords: Donation, Heart, Kidney, Liver
Topic: Clinical Science » Organ Inclusive » Deceased Donor Management and Intervention Research
Session Information
Session Time: 7:30pm-8:30pm
 Presentation Time: 8:10pm-8:20pm
Location: Virtual
*Purpose: To understand the demographic change in deceased donor causes of death associated with drug intoxication, we explored trends over the 10-year period ending in 2019.
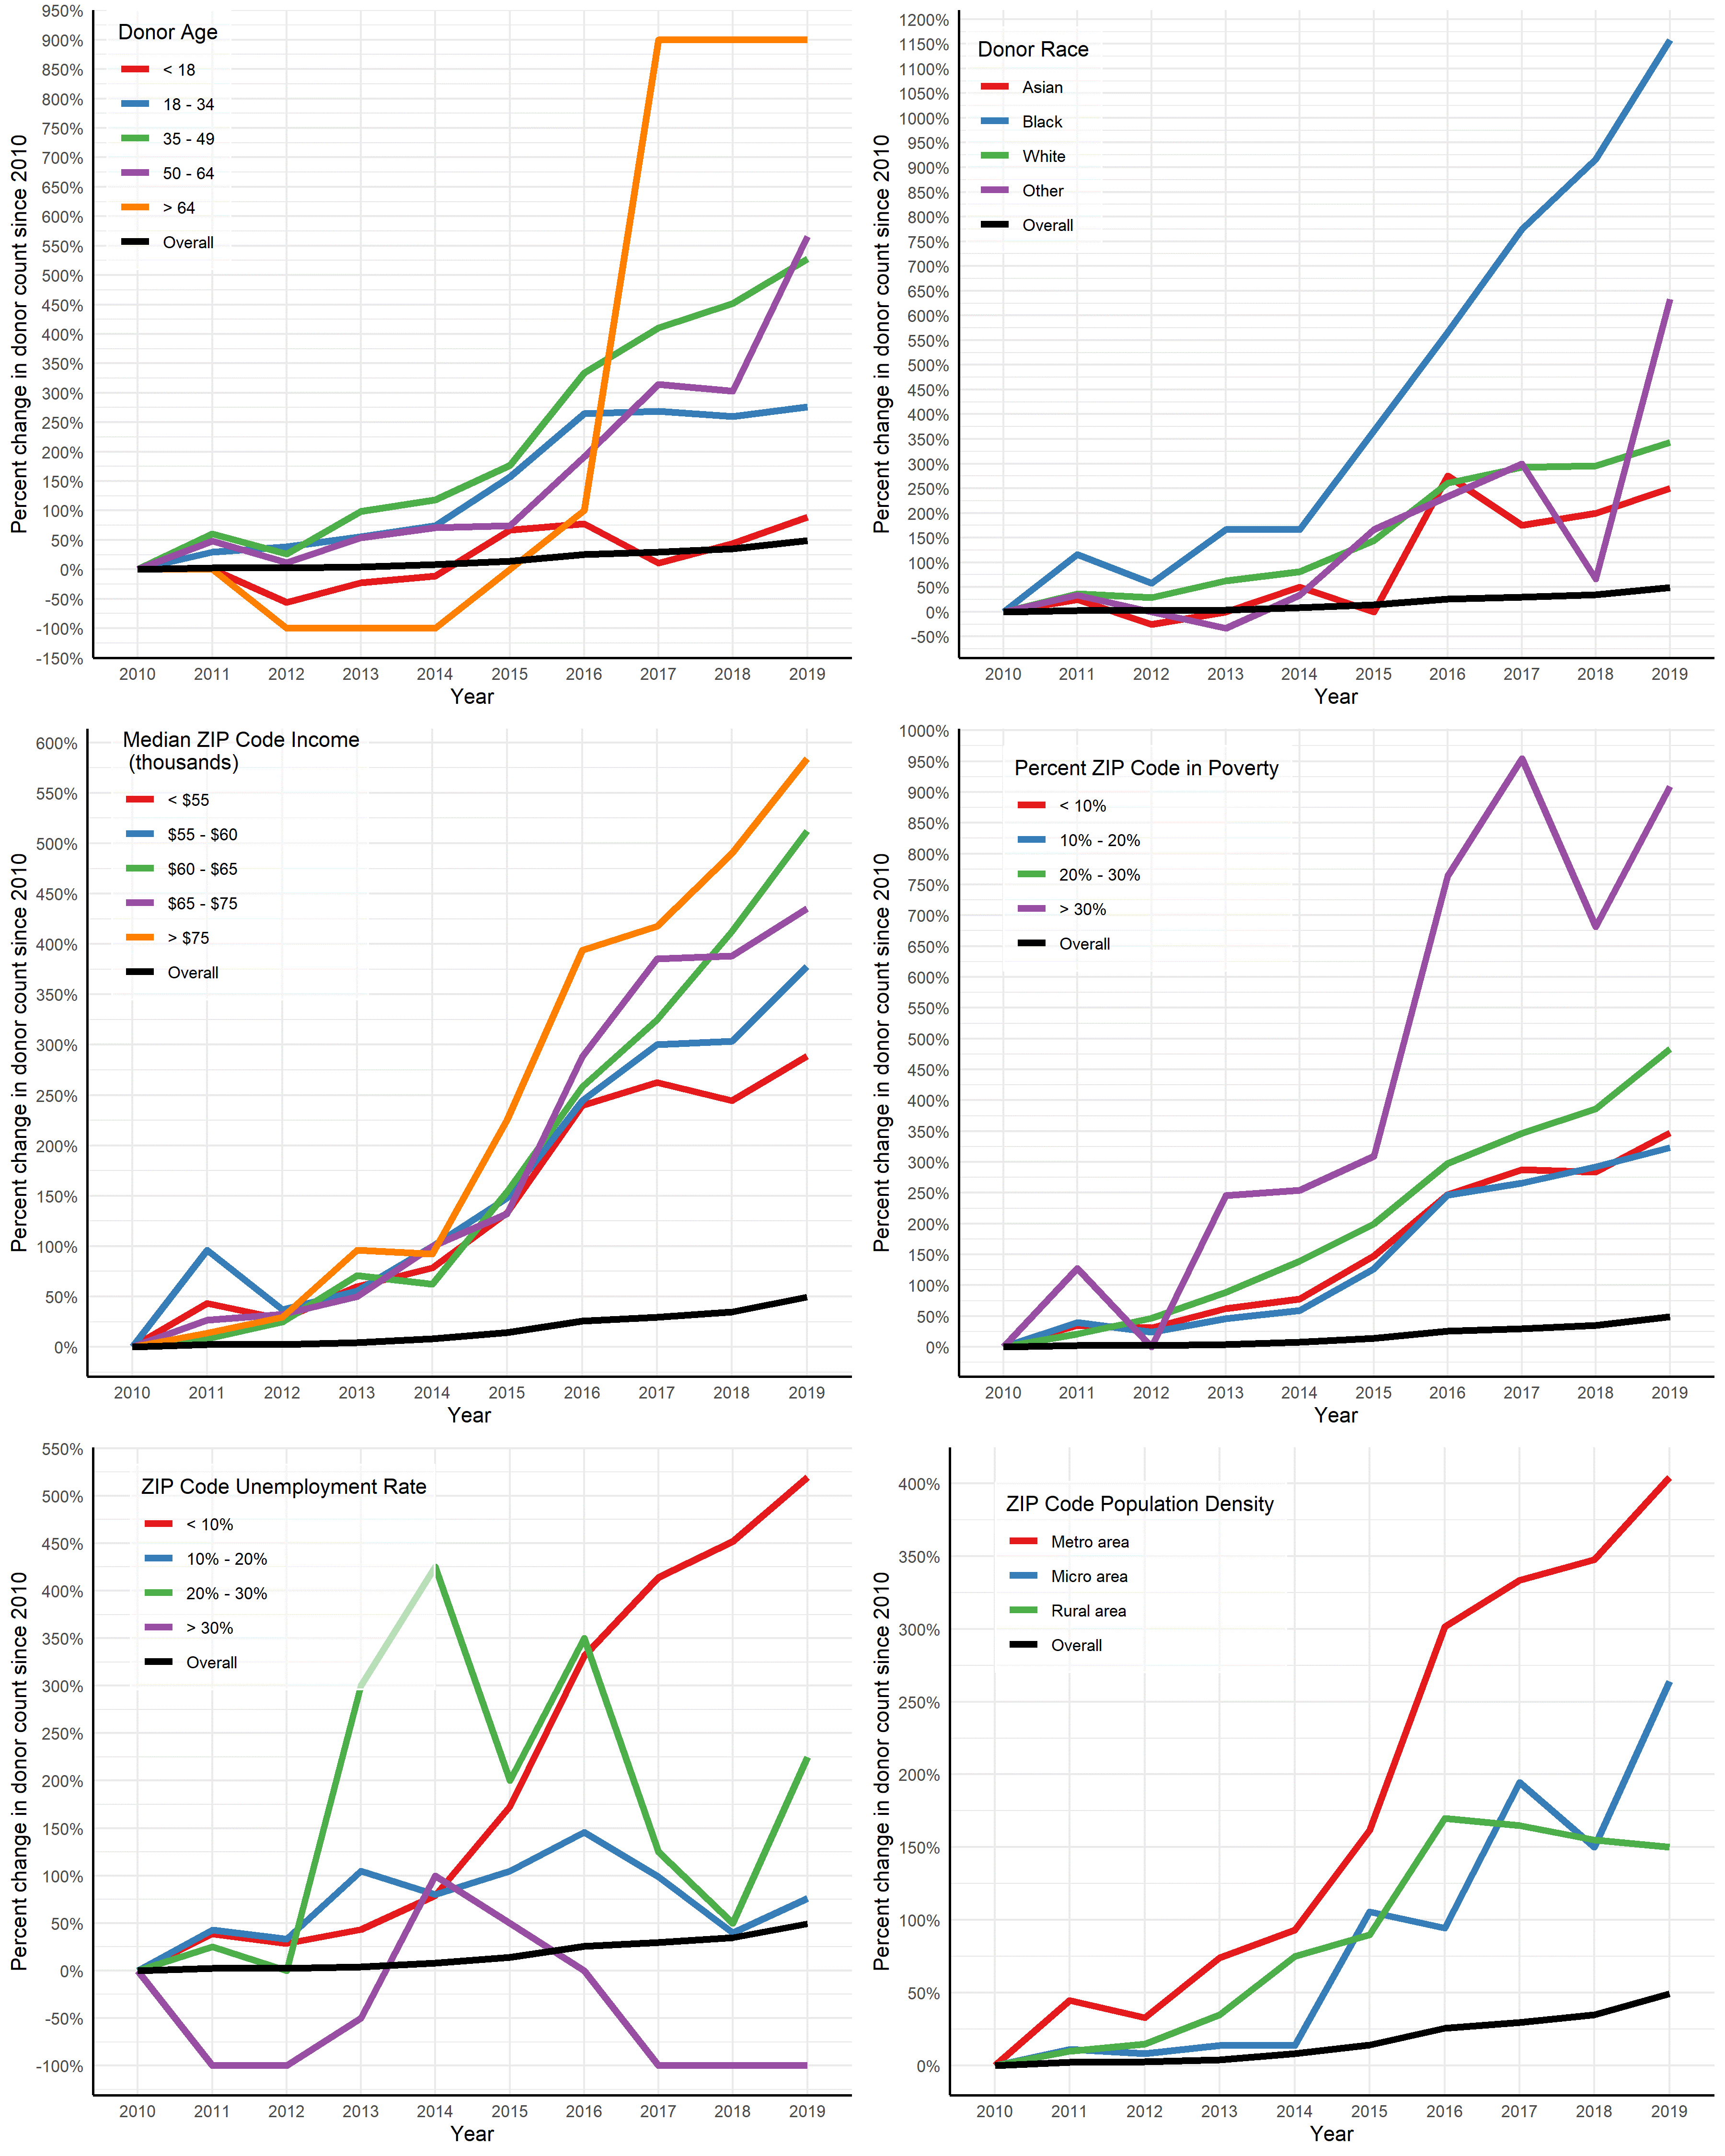
*Methods: Over the period of interest, we analyzed all deceased donors with a mechanism of death reported as “drug intoxication” on the deceased donor registration form. Donors included were those in whom at least one organ was transplanted and those with at least one organ recovered for transplant. Demographics of interest included age and race as well as geo-referenced information obtained from each donor’s home ZIP code (Figure 1). Geo-referenced information included ZIP code-level median income, percent of households with income below the poverty threshold, unemployment rate, and population density.
*Results: Overall, the number of donors with drug intoxication deaths grew 374% from 2010 to 2019. Donors aged 17 or younger with drug intoxication saw an 89% increase, while all adult age groups saw a rise in donations, with those aged 50 or older seeing the sharpest increases, at over 500%. All races had an increase in donors with drug intoxication of over 200%, with Black donors having the largest increase, at over 1100%. Turning to geo-referenced information, donors increased across all income levels by at least 250%, with donors from ZIP codes with a median annual income higher than $75,000 seeing the largest increase, at over 500%. Donors from ZIP codes with the lowest unemployment rates and highest poverty rates saw the largest increase. Lastly, donors from metro areas saw the greatest growth, at over 400%, with donors from micropolitan and rural areas seeing lower but still moderate growth.
*Conclusions: In all cases, for both demographic and geo-referenced information, the differences in rates from 2010 to 2019 were statistically significant (P < 0.05). Thus, donors who died from drug intoxication over the last decade increased, many of them from vulnerable populations.
Figure 1. Deceased donor drug intoxication death percent change from 2010 by age, race, and ZIP code median income, percent poverty, unemployment rate, and population density. The black curve denotes the percent change in the overall donor count since 2010.
To cite this abstract in AMA style:
Musgrove D, Zaun D, Israni A, Snyder J. Change in Deceased Donor Demographics with Drug Intoxication Deaths: 2010 – 2019 [abstract]. Am J Transplant. 2021; 21 (suppl 3). https://atcmeetingabstracts.com/abstract/change-in-deceased-donor-demographics-with-drug-intoxication-deaths-2010-2019/. Accessed February 17, 2026.« Back to 2021 American Transplant Congress

