Absolute Quantification of Micro RNA and Messenger RNA Using a Customized Amplicon in Real Time Quantitative Polymerase Chain Reaction Assays
WCMC, New York, NY
Meeting: 2019 American Transplant Congress
Abstract number: A173
Keywords: Gene expression, Polymerase chain reaction (PCR)
Session Information
Session Name: Poster Session A: Biomarkers, Immune Monitoring and Outcomes
Session Type: Poster Session
Date: Saturday, June 1, 2019
Session Time: 5:30pm-7:30pm
 Presentation Time: 5:30pm-7:30pm
Location: Hall C & D
*Purpose: Transcript abundance in biological specimens quantified by RT-PCR assay is typically expressed as fold change between groups. Absolute quantification is preferable to relative quantification and is accomplished using gene specific standard curves. A universal standard curve (USC) can overcome limitations related to current relative quantification protocols. We have developed a USC and shown its utility for quantifying mRNA abundance in urinary cells of kidney allograft recipients. Herein, we show the utility of our USC for quantification of microRNA (miRNA) abundance in biological specimens.
*Methods: Step 1: We established the USC using 73bp mouse Bak amplicon as the standard. Step 2: We established gene-specific standard curves for the mRNAs/miRNAs that we have reported as biomarkers informative of kidney allograft status. Step 3: We calculated the amplification efficiency (E) of individual mRNAs/miRNAs as E=(10-1/slope-1)x100. An ideal E of 100% means that the PCR product is doubled in every PCR cycle. Step 4: We show that E of individual mRNA/miRNA amplicon-based standard curves were between 90-110%, thus allowing a single Bak amplicon-based standard curve as a USC for absolute quantification of transcripts.
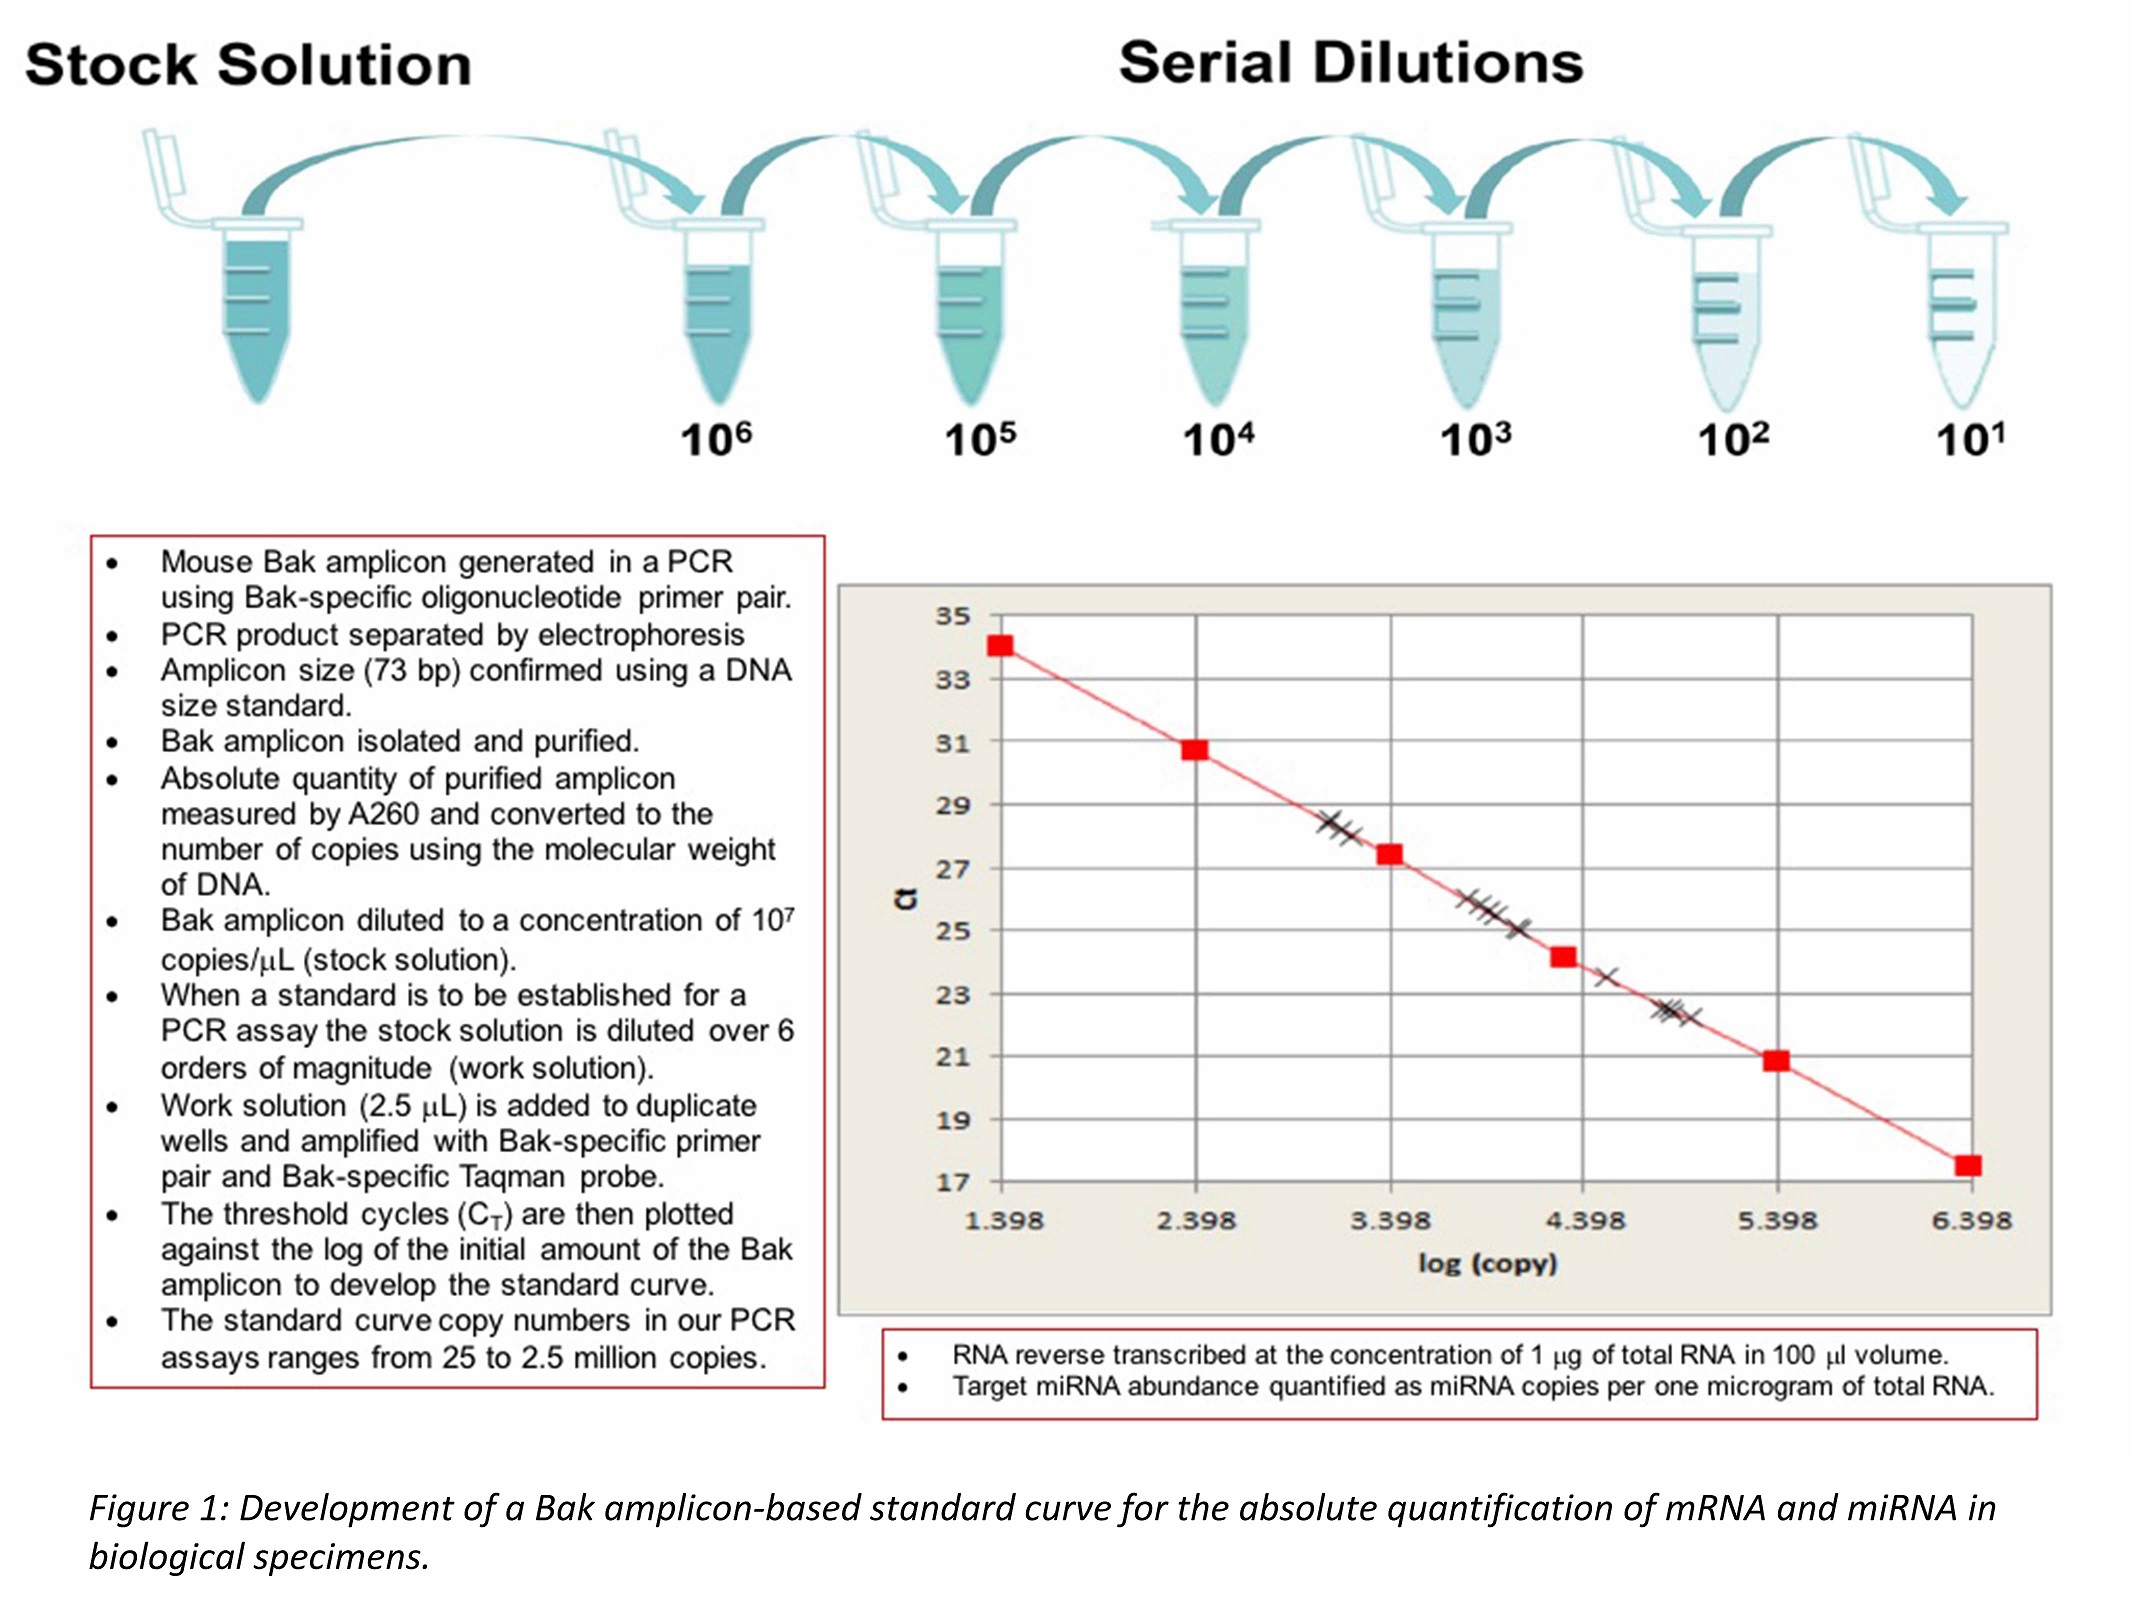
*Results: We generated the amplicon in a PCR using a thermal cycler, purified, quantified, and diluted it to a concentration of 107 copies/ul stock solution. For RT-PCR assay, we established the standard curve by diluting the stock solution over 6 orders of magnitude (106 to 101 copies/µl) (Figure 1).
The E of Bak standard was 101.9%. The E for individual gene specific standards were between 99.7% and 102.6% for mRNAs of CD3, IP10, TGFb, and Granzyme B, and 18S rRNA, and between 98.9% and 103.7% for miRNAs 10b, 30c, 143-3p, and 21 (Figure 2).
*Conclusions: The universal standard curve generated with the Bak amplicon, in addition to allowing for precise quantification of multiple mRNAs and miRNAs in biological specimens without the need for individual gene-specific standard curves, obviates limitations related to existing relative quantification protocols.
To cite this abstract in AMA style:
Li C, Snopkowski C, Cassidy M, Botticelli B, Albakry S, Lee JR, Lubetzky M, Dadhania D, Yang H, Ding R, Muthukumar T, Suthanthiran M. Absolute Quantification of Micro RNA and Messenger RNA Using a Customized Amplicon in Real Time Quantitative Polymerase Chain Reaction Assays [abstract]. Am J Transplant. 2019; 19 (suppl 3). https://atcmeetingabstracts.com/abstract/absolute-quantification-of-micro-rna-and-messenger-rna-using-a-customized-amplicon-in-real-time-quantitative-polymerase-chain-reaction-assays/. Accessed February 7, 2026.« Back to 2019 American Transplant Congress


