A 5-Tier System for Categorizing Program-Specific Adjusted Transplant and Waitlist Mortality Rate Ratios
SRTR, Minneapolis.
Meeting: 2018 American Transplant Congress
Abstract number: B311
Keywords: Methodology, Prediction models, Public policy, Waiting lists
Session Information
Session Name: Poster Session B: Non-Organ Specific: Economics, Public Policy, Allocation, Ethics
Session Type: Poster Session
Date: Sunday, June 3, 2018
Session Time: 6:00pm-7:00pm
 Presentation Time: 6:00pm-7:00pm
Location: Hall 4EF
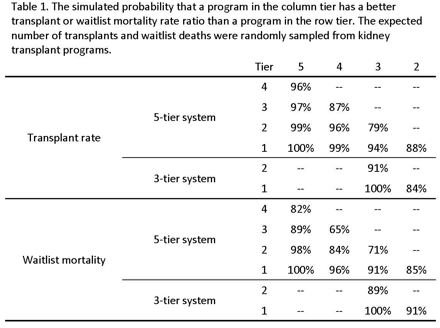
SRTR may begin reporting tiers for program-specific transplant and waitlist mortality rate ratios. A 3-tier system based on statistical hypothesis testing has several deficiencies. Waitlist mortality has poor differentiation in tier 2 because of insufficient sample size to achieve statistical significance except for extreme deviations from average. In contrast, transplant rate has poor differentiation in tiers 1 and 3 because clinically insignificant differences can achieve statistical significance due to a 10-fold increase in effective sample size. Separate 5-tier systems were developed for risk-adjusted transplant and waitlist mortality rate ratios. The within-tier sum of squares compared program differentiation with the period-prevalent cohort of adult candidates on the waiting list between July 1, 2014, and June 30, 2016. SRTR risk-adjustment models accounted for candidate characteristics. The misclassification rate was simulated with the distribution of expected events from the period-prevalent cohort. In kidney transplantation, the 5-tier system reduced the within-tier sum of squares by approximately 60% for both transplant and waitlist mortality rate ratios (Figure 1). Results were similar for liver, lung, and heart transplant. For the transplant rate ratio, the misclassification rate of the 5-tier system was particularly low; only tier 3 programs had less than 85% probability of having a better transplant rate ratio than tier-2 programs (Table 1). Thus, the 5-tier system should provide more informative reporting of transplant and waitlist mortality rate ratios due to better differentiation and a relatively low misclassification rate.
Figure 1. The distribution of adjusted transplant and waitlist mortality rate ratios for adult kidney transplant programs.
SRTR risk-adjustment models are at https://www.srtr.org/reports-tools/risk-adjustment-models-waiting-list-preview/
CITATION INFORMATION: Wey A., Salkowski N., Kasiski B., Israni A., Snyder J. A 5-Tier System for Categorizing Program-Specific Adjusted Transplant and Waitlist Mortality Rate Ratios Am J Transplant. 2017;17 (suppl 3).
To cite this abstract in AMA style:
Wey A, Salkowski N, Kasiski B, Israni A, Snyder J. A 5-Tier System for Categorizing Program-Specific Adjusted Transplant and Waitlist Mortality Rate Ratios [abstract]. https://atcmeetingabstracts.com/abstract/a-5-tier-system-for-categorizing-program-specific-adjusted-transplant-and-waitlist-mortality-rate-ratios/. Accessed July 18, 2025.« Back to 2018 American Transplant Congress

