Phenotypic and Functional Assessment of T Cell Alloimmunity After Liver Transplantation.
Mayo Clinic, Rochester, MN
Meeting: 2017 American Transplant Congress
Abstract number: B46
Keywords: Immune deviation, Liver, T cell reactivity
Session Information
Session Name: Poster Session B: Allorecognition and T Cell Biology
Session Type: Poster Session
Date: Sunday, April 30, 2017
Session Time: 6:00pm-7:00pm
 Presentation Time: 6:00pm-7:00pm
Location: Hall D1
In addition to its metabolic functions, the liver is also an immunologically active organ. Liver transplant recipients are often maintained on less immunosuppression when compared to recipients of other organ allografts. Recent evidence suggests that the liver allograft can also protect simultaneously transplanted other organs from alloimmune injury. The extent and mechanisms of this liver-induced alloimmune hyporesponsiveness are not known well.
Methods: PBMC from of liver (LT) and kidney transplant (KT) recipients (n=30 each) with no recent (6 months) rejection and similar immunosuppression were collected more than 1 year after transplantation. The leukocyte immunophenotypes were compared with 10-color flow cytometry. In vitro assessment of the T cell alloimmune responses was done by testing their proliferation in response to allostimulation (donor PBMC) by both 3H-thymidine incorporation and CSFE dilution, and by IFNɤ production (ELIspot).
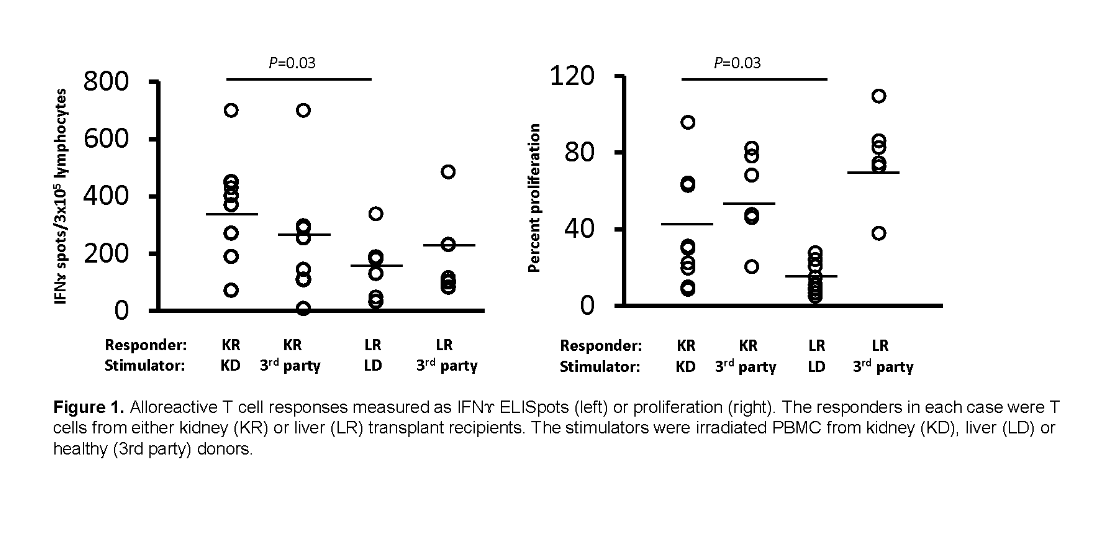
Results: While the absolute numbers of T cells were similar in both groups, the CD4:CD8 T cell ratio was higher in LT (0.99 vs. 0.41; P=0.04). Among the CD4+ T cells, the average fraction of CD154+ (antigen-dependent activated) and CD45RO+ CCR7– CD62L– (effector memory, TEM) was higher in KT (12.1 vs. 6.2%; P=0.04 and 22.8 vs. 17.2%; P=0.05, respectively), whereas the CD45RO+ CCR7+ CD62L+ (central memory, TCM) fraction was higher in LT (29.7 vs. 39.2%, P=0.04). The ratio of CD8+ TEM (58.5 vs. 53.4, P=0.8) and CD8+ TCM (2.4 vs 3.1%, P=0.8) were similar among the two groups. A higher percentage of the KT CD4+ T cells demonstrated markers for T cell exhaustion (CTLA and PD-1) (4.3% CD4+CTLA+ and 49.7% CD4+PD1+ in KT vs. 2.2% and 37.6%, respectively in LT [P=0.01]). IFNɤ ELISpots produced by the peripheral T cells of the LT was lower than those of the KT (Fig 1). Their response to stimulation by 3rd party antigens was not altered. The overall proliferative capacity of both CD4 and CD8 LT T cells was diminished, compared to KT T cells. Neither the frequency nor the proliferation capacity of CD4+CD25+Foxp3+ cells was different.
Conclusions: Phenotypic and functional analysis shows that LT induces alloantigen-specific hyporesponsiveness in the host associated with exhaustion.
CITATION INFORMATION: Taner T, Hansen M, Park W, Stegall M. Phenotypic and Functional Assessment of T Cell Alloimmunity After Liver Transplantation. Am J Transplant. 2017;17 (suppl 3).
To cite this abstract in AMA style:
Taner T, Hansen M, Park W, Stegall M. Phenotypic and Functional Assessment of T Cell Alloimmunity After Liver Transplantation. [abstract]. Am J Transplant. 2017; 17 (suppl 3). https://atcmeetingabstracts.com/abstract/phenotypic-and-functional-assessment-of-t-cell-alloimmunity-after-liver-transplantation/. Accessed February 10, 2026.« Back to 2017 American Transplant Congress
