Using Visual Icons to Present Program Transplant Rate Information to the Public: Results of a Randomized Trial
1Department of Medicine, Hennepin County Medical Center (HCMC), University of Minnesota (UMN), Minneapolis, MN
2Department of Epidemiology and Community Health, UMN, Minneapolis, MN
3Department of Planning, Public Policy and Management, University of Oregon, Eugene, OR
4College of Design, UMN, Minneapolis, MN
5Minneapolis Medical Research Foundation, Minneapolis, MN.
Meeting: 2018 American Transplant Congress
Abstract number: B304
Keywords: Patient education
Session Information
Session Name: Poster Session B: Non-Organ Specific: Economics, Public Policy, Allocation, Ethics
Session Type: Poster Session
Date: Sunday, June 3, 2018
Session Time: 6:00pm-7:00pm
 Presentation Time: 6:00pm-7:00pm
Location: Hall 4EF
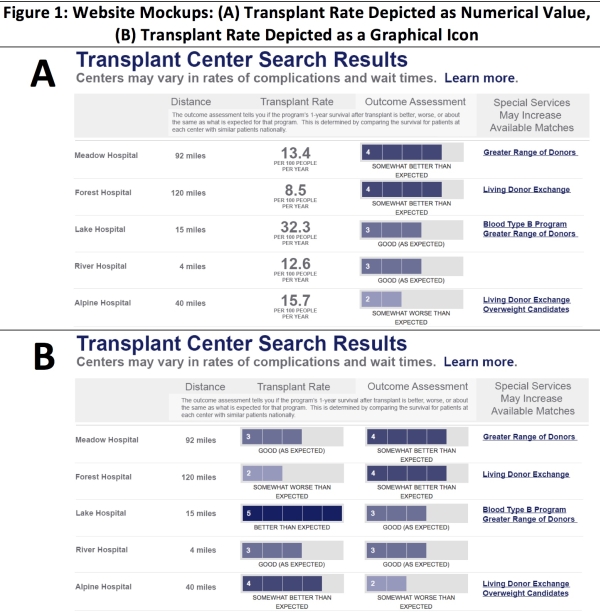
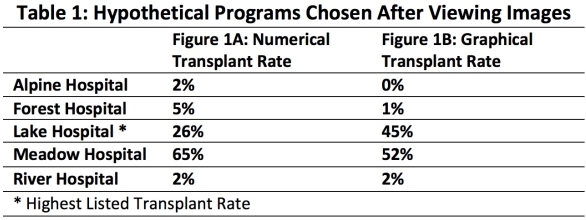
The Scientific Registry of Transplant Recipients (SRTR) provides federally mandated program-specific transplant data to the public. SRTR recently developed new website materials to make statistical information more relevant for patient decision-making. Currently, there is little understanding of how new visual icons for common metrics might impact decision making. This study recruited 368 computer literate individuals across the United States from Amazon Mechanical Turk. Each was randomly shown either an SRTR webpage mockup displaying transplant rate as a numerical value (A) or as a visual icon (B). Participants viewed a list of hypothetical programs with realistic data. Program values were chosen to depict a trade-off between pretransplant and posttransplant metrics. Participants answered 8 questions about decisions, including the program they would choose based on the mockup and the metric that was most important. Average age was 36 (min 19, max 84); 41% completed less than a college degree. 24% indicated exposure to transplant through friends or family. The percent choosing a program with the highest listed deceased donor transplant rate was 26% when displayed numerically and 45% when shown graphically (p<0.001).
 A graphical display of transplant rate increased the likelihood of a high transplant rate influencing decisions and is being considered by SRTR.
CITATION INFORMATION: Schaffhausen C., Chu S., Bruin M., Hibbard J., Snyder J., Kasiske B., Israni A. Using Visual Icons to Present Program Transplant Rate Information to the Public: Results of a Randomized Trial Am J Transplant. 2017;17 (suppl 3).
To cite this abstract in AMA style:
Schaffhausen C, Chu S, Bruin M, Hibbard J, Snyder J, Kasiske B, Israni A. Using Visual Icons to Present Program Transplant Rate Information to the Public: Results of a Randomized Trial [abstract]. https://atcmeetingabstracts.com/abstract/using-visual-icons-to-present-program-transplant-rate-information-to-the-public-results-of-a-randomized-trial/. Accessed July 14, 2025.« Back to 2018 American Transplant Congress
