Trends in Liver Transplant Rates and Waitlist Survival.
JHU, Baltimore.
Meeting: 2016 American Transplant Congress
Abstract number: B243
Keywords: Allocation, Liver transplantation, Mortality, Waiting lists
Session Information
Session Name: Poster Session B: Liver: MELD, Allocation and Donor Issues (DCD/ECD)
Session Type: Poster Session
Date: Sunday, June 12, 2016
Session Time: 6:00pm-7:00pm
 Presentation Time: 6:00pm-7:00pm
Location: Halls C&D
Long term changes in access to deceased-donor liver transplantation(DDLT) due to persistent growth of the waitlist, stagnant organ availability, and intermittent allocation policy changes have not been previously characterized.
METHODS We studied trends in liver transplant rates and waitlist survival among adult non-status 1 DDLT candidates using 2005-2015 SRTR data stratified by time-varying allocation MELD(categorized as <15, 15-24, 25-35, and ≥35). We used multilevel Poisson regression to estimate transplant rate per person-year accounting for OPO-level variation, and competing risks regression to estimate changes in waitlist mortality given DDLT over time.
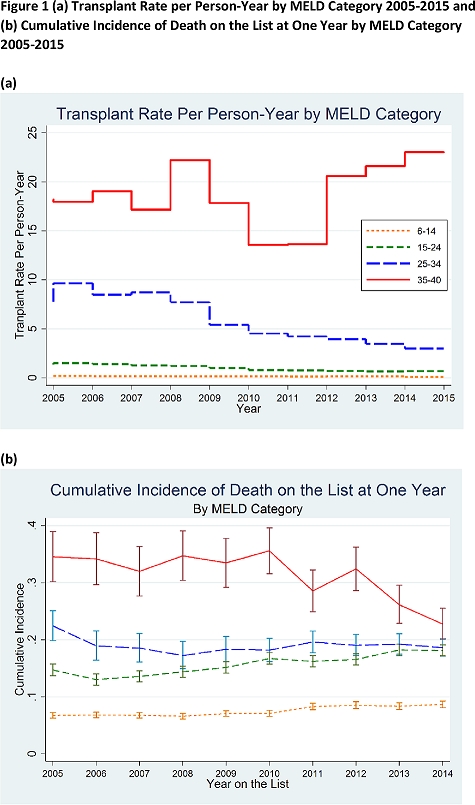
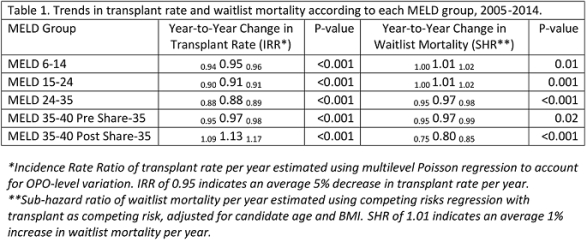
RESULTS Since 2005, the overall transplant rate has declined 6% per year(IRR0.930.940.94,p<0.001), however, the trend varied across MELD categories(p-interaction<0.001). Transplant rates declined 5% per year among candidates with MELD <15, 9% per year among those with MELD 15-24, and 12% per year among those with MELD 25-34(p-values<0.001). These existing trends did not change under Share 35(p-interactions>0.05). In the >35 MELD category, transplant rates declined 3% per year prior to Share 35, yet increased 13% per year post-Share 35(p-interaction=0.02). Risk of death on the list increased by 1% per year for <15 and 15-24 MELD groups(p<0.001), however it decreased by 3% per year for those with MELD 25-34. Among those with MELD>35, risk of death decreased by 3% per year pre-Share 35 and by 20% per year post-Share 35(p-interaction<0.001).
CONCLUSION Candidates with MELD 25-34 experienced significant declines in transplant rates, yet waitlist survival improved. Possible explanations include improvements in care or changing listing practices to avoid high center waitlist mortality. While Share 35 improved outcomes for those at highest risk, trends in lower MELD groups were unaffected, supporting the allocation model.


CITATION INFORMATION: Bowring M, Massie A, Luo X, Kucirka L, Chow E, Cameron A, Segev D. Trends in Liver Transplant Rates and Waitlist Survival. Am J Transplant. 2016;16 (suppl 3).
To cite this abstract in AMA style:
Bowring M, Massie A, Luo X, Kucirka L, Chow E, Cameron A, Segev D. Trends in Liver Transplant Rates and Waitlist Survival. [abstract]. Am J Transplant. 2016; 16 (suppl 3). https://atcmeetingabstracts.com/abstract/trends-in-liver-transplant-rates-and-waitlist-survival/. Accessed February 3, 2026.« Back to 2016 American Transplant Congress
