Single Cell RNA Sequencing of Normal Kidney Allograft Surveillance Biopsies Show Evidence of Dynamic Glomerular Endothelial Cell Activation
University of Michigan, Ann Arbor, MI
Meeting: 2020 American Transplant Congress
Abstract number: 640
Keywords: Endothelial activation, Endothelial cells, Interferon (IFN), Kidney transplantation
Session Information
Session Time: 11:29am-12:13pm
 Presentation Time: 11:30am-11:37am
Location: Main Channel
*Purpose: Indication and surveillance biopsy studies show a high prevalence of post kidney transplant (KT) glomerular disease (ElZoghby 2009,Stegall 2017) that cannot be explained by immune mechanisms alone.Glomerular Endothelial Cell (GEC) injury has been implicated in initiation and propagation of glomerular disease.We hypothesized that investigating natural response of GECs to KT might offer insight into what initiates and drives glomerular injury.
*Methods: Research cores were taken from histologically normal pre-perfusion living donor biopsies (n=3), 3month (n=3) and 12month surveillance (n=3) biopsies. Banff 2017 scoring was performed. ScRNA-seq was performed on a 10X chromium platform and processed per KPMP protocols. Cell-type-specific markers were used for cell clustering. Enrichment analysis for biological pathways was performed with Enrichr tool using NCI 2016 pathway interaction database.Trajectory analysis was performed to identify discrete GEC activation states.
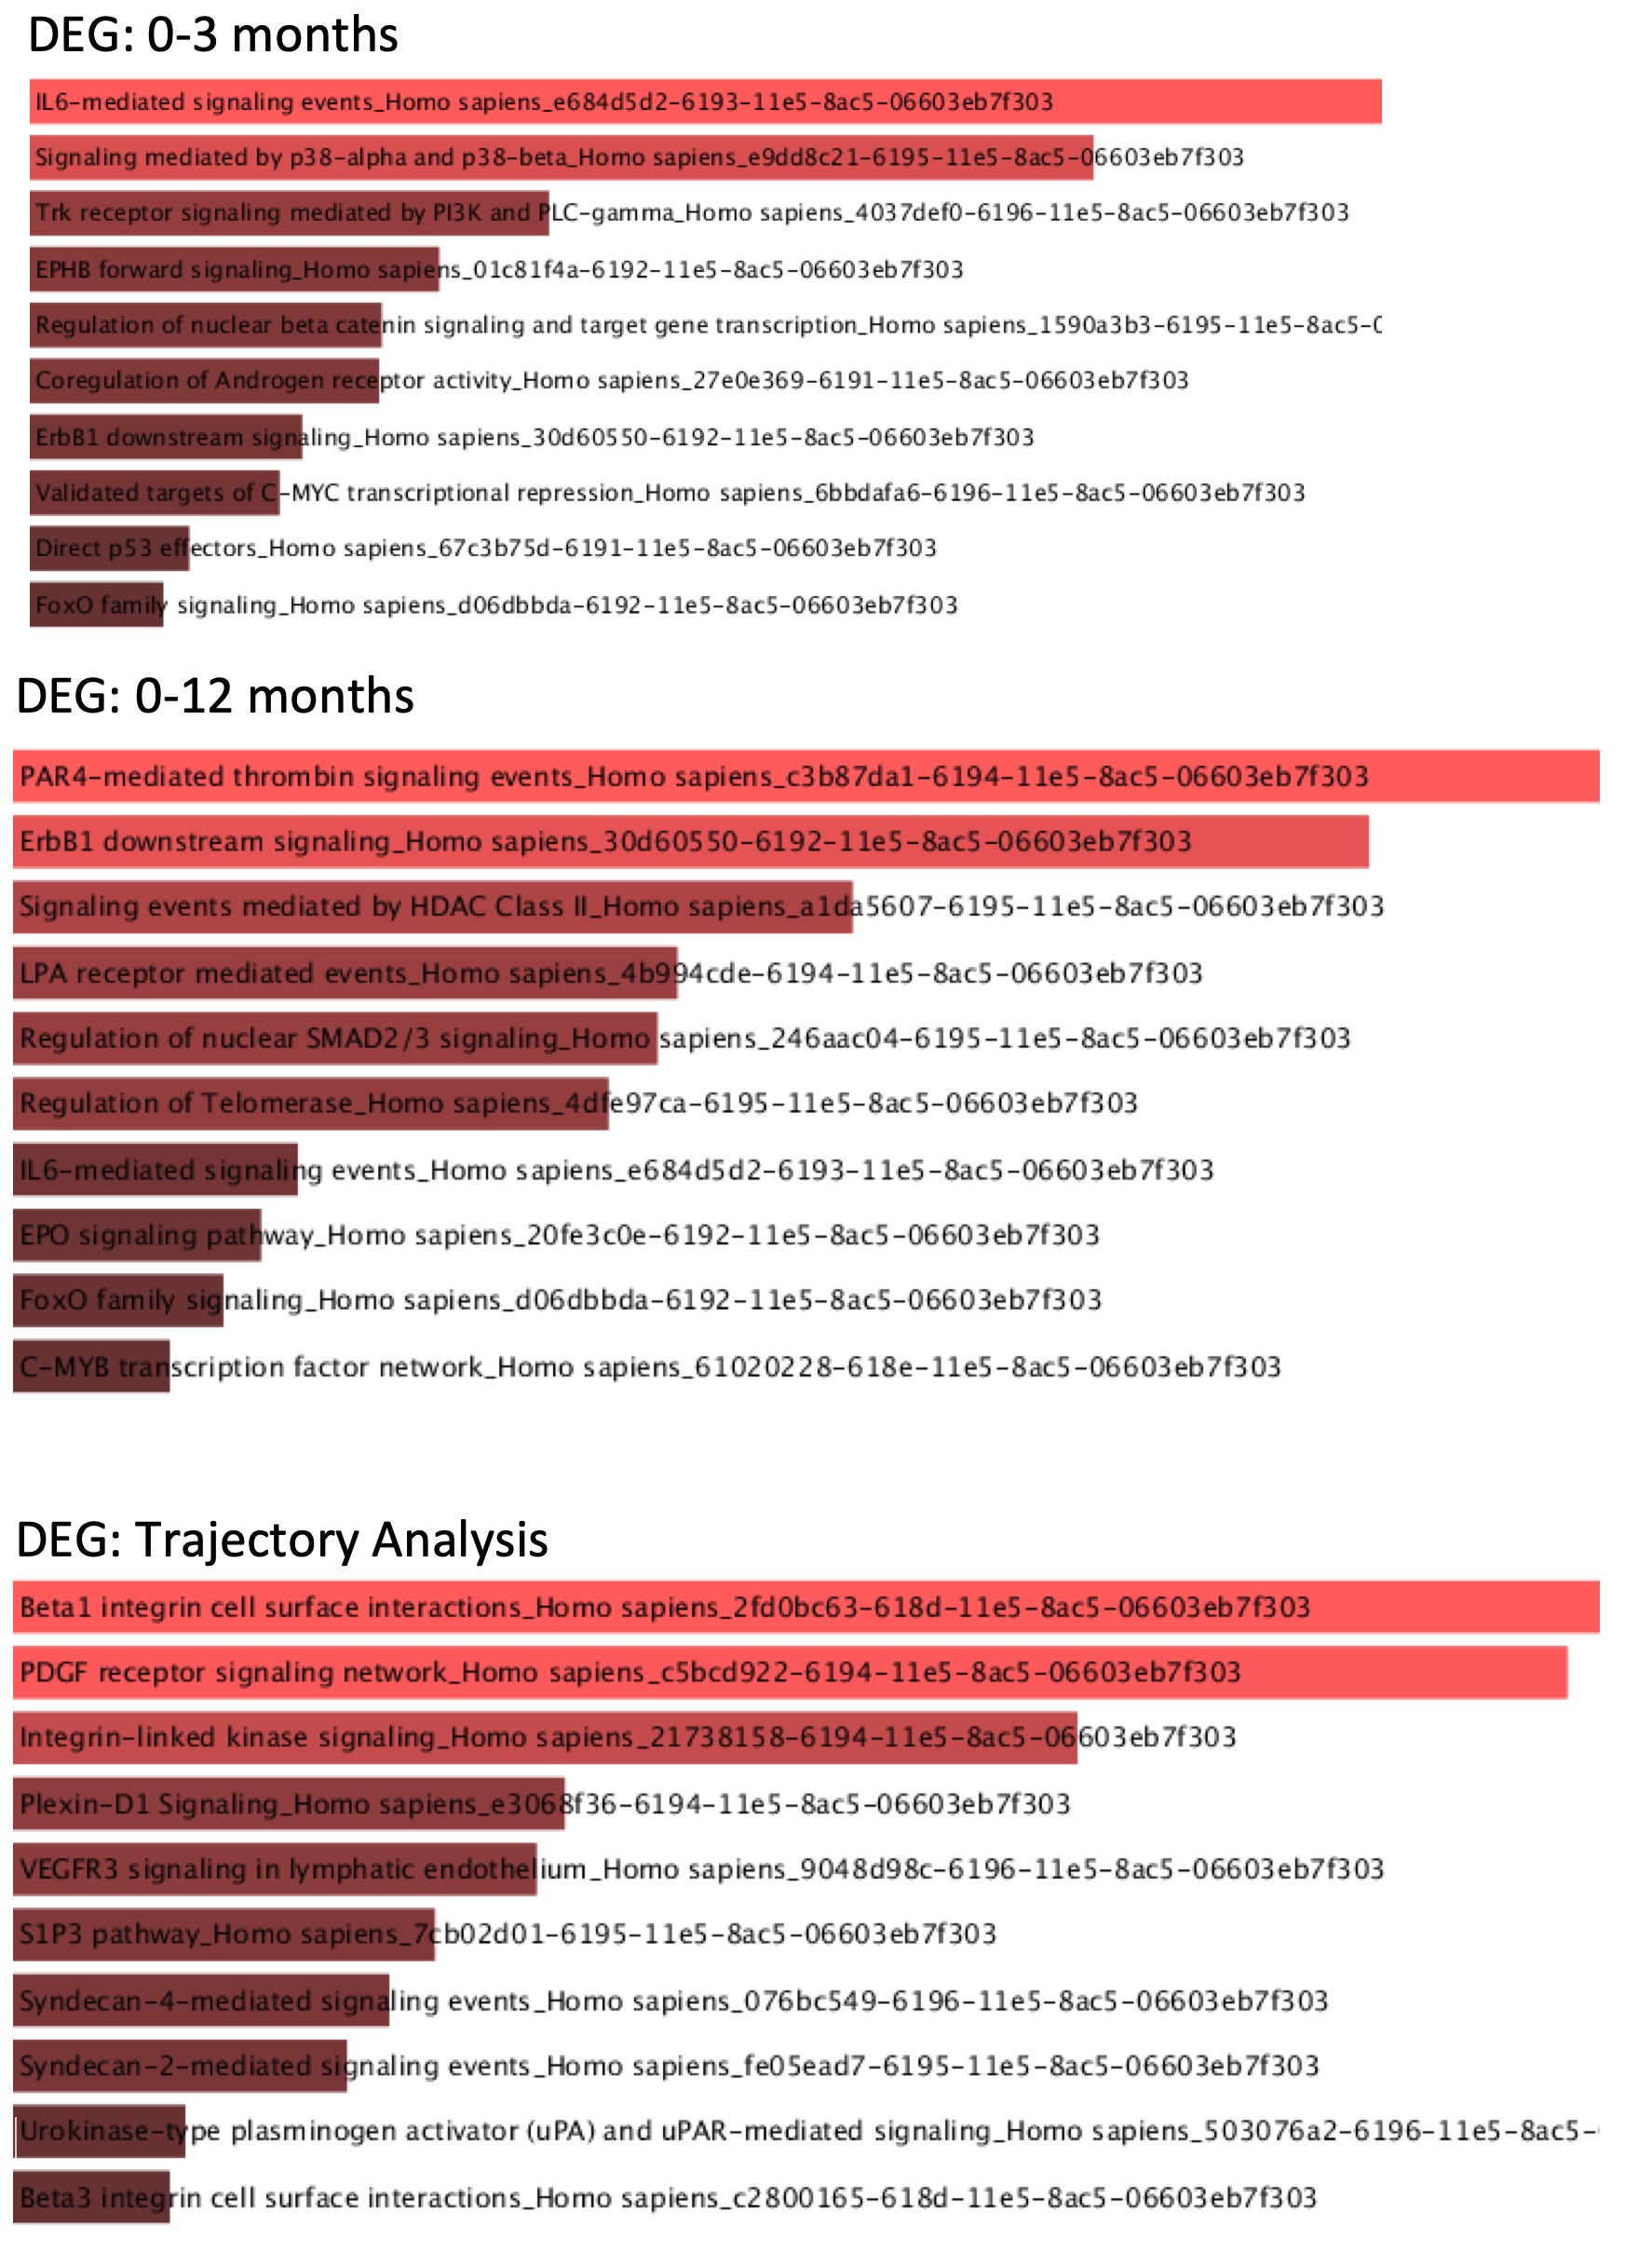
*Results: Histology showed no microvascular/interstitial inflammation. All patients had stable function,no rejection/infections or circulating DSAs. Analysis revealed 22unique cell clusters with 3 EC clusters (GECs, PTC and arteriole). GECs ranged from 6-105/sample with an average of 44 GECs. Differentially Expressed Genes (DEG) between GECs of Group1 (0-3-month) and Group2 (0-12-month) are enriched for pathways shown in Figure 1 Top 2 panels.
.
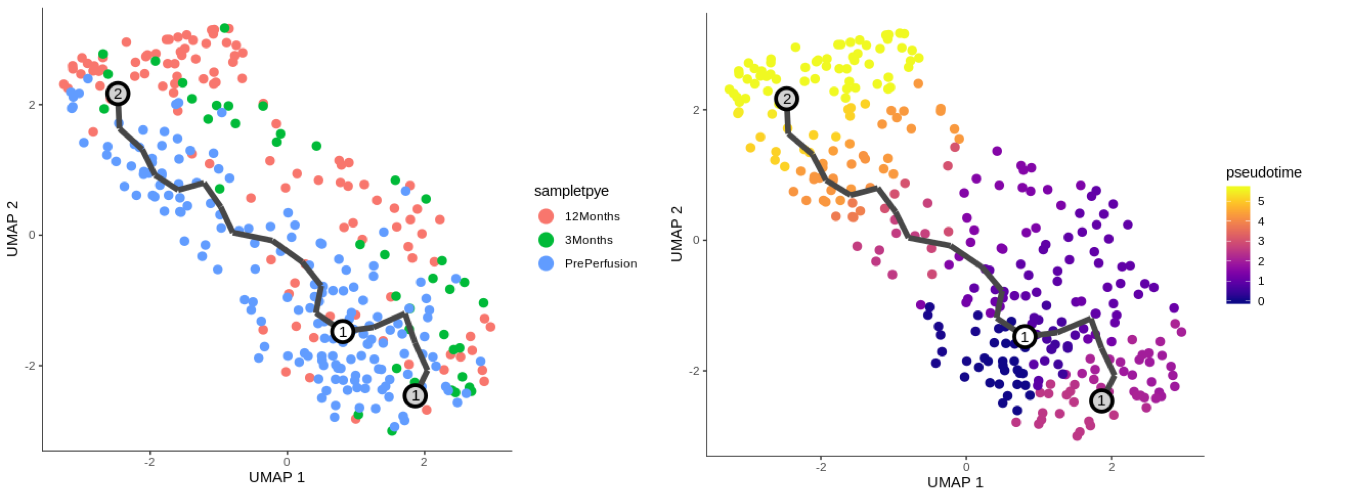
Trajectory analysis revealed 2 distinct GEC activation states (Figure 2, right panel). GECs from 12 month biopsies had substantial overlap with second activation state (left panel).
Top 100 DEGs between the 2 activation states demonstrates enrichment of DEG associated with cell-cell, cell-matrix adhesion, angiogenesis and growth factors. Figure 1, bottom panel.
*Conclusions: Trajectory analysis in histologically normal KTs reveals dynamic changes in GECs with a progressive increase in DEG associated with cell-cell, cell-matrix adhesion, angiogenesis and growth factors that drive fibroblast and smooth muscle cell proliferation. Our scRNAseq data establish a progredient GEC activation signature in absence of structural damage.
To cite this abstract in AMA style:
Naik AS, Menon R, Otto E, Berthier CC, Farkash E, Norman SP, Kretzler M. Single Cell RNA Sequencing of Normal Kidney Allograft Surveillance Biopsies Show Evidence of Dynamic Glomerular Endothelial Cell Activation [abstract]. Am J Transplant. 2020; 20 (suppl 3). https://atcmeetingabstracts.com/abstract/single-cell-rna-sequencing-of-normal-kidney-allograft-surveillance-biopsies-show-evidence-of-dynamic-glomerular-endothelial-cell-activation/. Accessed February 23, 2026.« Back to 2020 American Transplant Congress


