Simulation vs. Reality: 250NM as First Unit of Lung Allocation
1SRTR, Minneapolis, MN, 2Cleveland Clinic Foundation, Cleveland, OH, 3OPTN, Richmond, VA, 4Univ. of Michigan, Ann Arbor, MI, 5Univ. of WA, Seattle, WA, 6Mayo Clinic, Rochester, MN
Meeting: 2019 American Transplant Congress
Abstract number: C340
Keywords: Allocation, Lung
Session Information
Session Name: Poster Session C: Lung: All Topics
Session Type: Poster Session
Date: Monday, June 3, 2019
Session Time: 6:00pm-7:00pm
 Presentation Time: 6:00pm-7:00pm
Location: Hall C & D
*Purpose: In November 2017, the OPTN Executive Committee removed donation service area as the first unit of donor allocation, replacing it with a circle of 250 nautical mile (NM) radius. The Scientific Registry of Transplant Recipients used thoracic simulated allocation modeling (TSAM) to model transplant and waitlist mortality rates using 250NM. We compared simulation predictions with data observed in the first 8 months after policy change.
*Methods: TSAM included candidates, recipients, and donors, July 1, 2009-June 30, 2011, and simulated match-runs according to lung allocation policy implemented in November 2017.
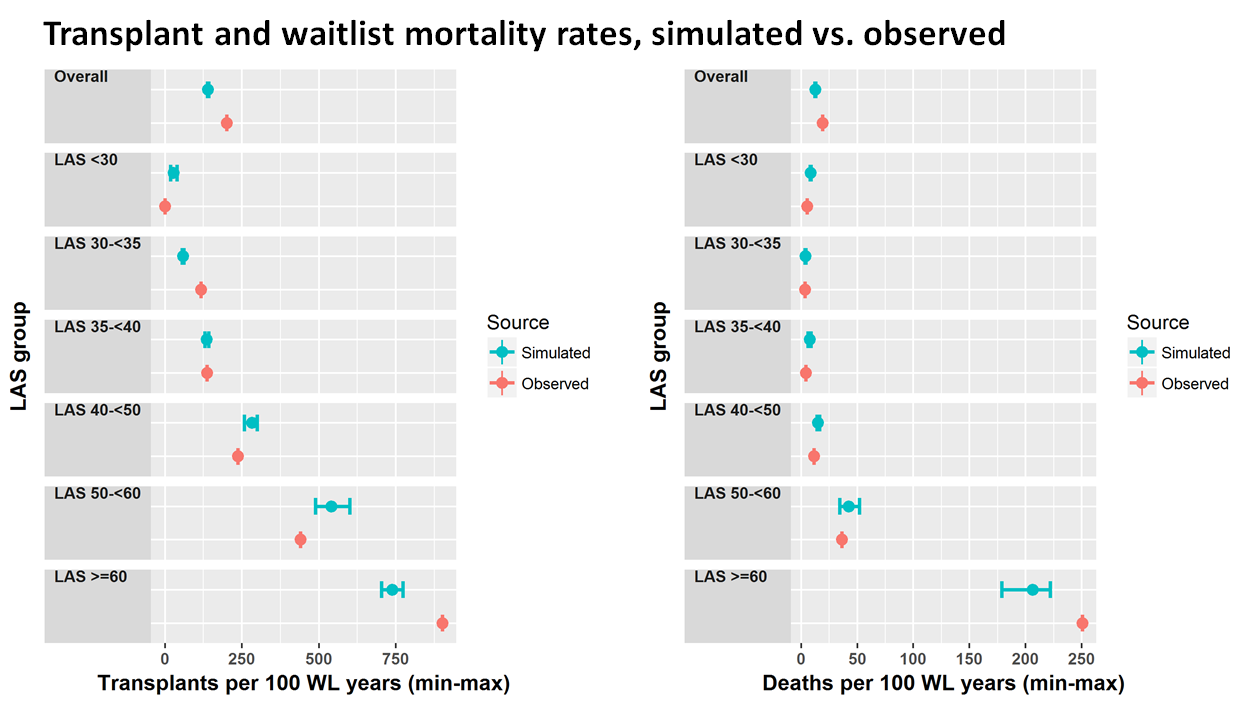
*Results: Overall observed transplant rates were higher than predicted rates, 202 transplants per 100 waitlist-years compared with 140. Overall observed waitlist mortality was also higher than predicted, 19.2 deaths per 100 waitlist-years compared with 12.8. The number of donors has increased considerably in recent years, which may explain the higher observed transplant rates.
Values for observed and predicted outcomes were not identical, but followed the same pattern. Simulation predicted higher transplant and waitlist mortality rates with higher lung allocation score (LAS). For candidates with LAS >=40, predicted transplant rates were 5- to 12-fold higher than for patients with LAS 30-<35. The pattern held in observed data; transplant rates were 2- to 8-fold higher in candidates with LAS >=40 compared with candidates with LAS 30-<35. Similarly, simulation predicted higher waitlist mortality for high-LAS groups. For candidates with LAS >=50, predicted waitlist mortality rates were 10 to 51 times higher than for candidates with LAS 30-<35. Post-implementation, observed waitlist mortality was 11 to 74 times higher for candidates with LAS >=50 than for candidates with LAS 30-<35.
*Conclusions: After implementation of 250NM as the first unit of lung allocation, observed transplant and waitlist mortality rates were similar to TSAM predicted patterns, although not precisely the same. Given the revision to the LAS following the TSAM cohort dates, this difference was expected. Nonetheless, TSAM remains a valuable tool for examining proposed allocation rules.
To cite this abstract in AMA style:
Skeans M, Pyke J, Lehr C, Lehman R, Uccellini K, Chan KM, Lease ED, Daly R, Valapour M. Simulation vs. Reality: 250NM as First Unit of Lung Allocation [abstract]. Am J Transplant. 2019; 19 (suppl 3). https://atcmeetingabstracts.com/abstract/simulation-vs-reality-250nm-as-first-unit-of-lung-allocation/. Accessed February 15, 2026.« Back to 2019 American Transplant Congress

