Rates of Live Donor Liver Transplantation Vary by Socioeconomic Status and Geography
D. R. Jorgensen, A. Humar, C. Hughes, M. Molinari, A. Ganoza, S. Ganesh, A. Duarte-Rojo, A. Tevar
Surgery, University of Pittsburgh, Pittsburgh, PA
Meeting: 2020 American Transplant Congress
Abstract number: B-162
Keywords: Liver transplantation, Living donor, Psychosocial, Risk factors
Session Information
Session Name: Poster Session B: Liver: Living Donors and Partial Grafts
Session Type: Poster Session
Date: Saturday, May 30, 2020
Session Time: 3:15pm-4:00pm
 Presentation Time: 3:30pm-4:00pm
Location: Virtual
*Purpose: Live donor liver transplantation (LDT) carries with it many benefits for the recipient, including reduced time on waitlist, transplantation at a lower meld score, and better outcomes. However, accessibility to LDT may depend on factors outside of a recipient’s transplant center. We wanted to examine whether individual and community socioeconomic status (SES) or geographic factors increase the odds of getting a LDT.
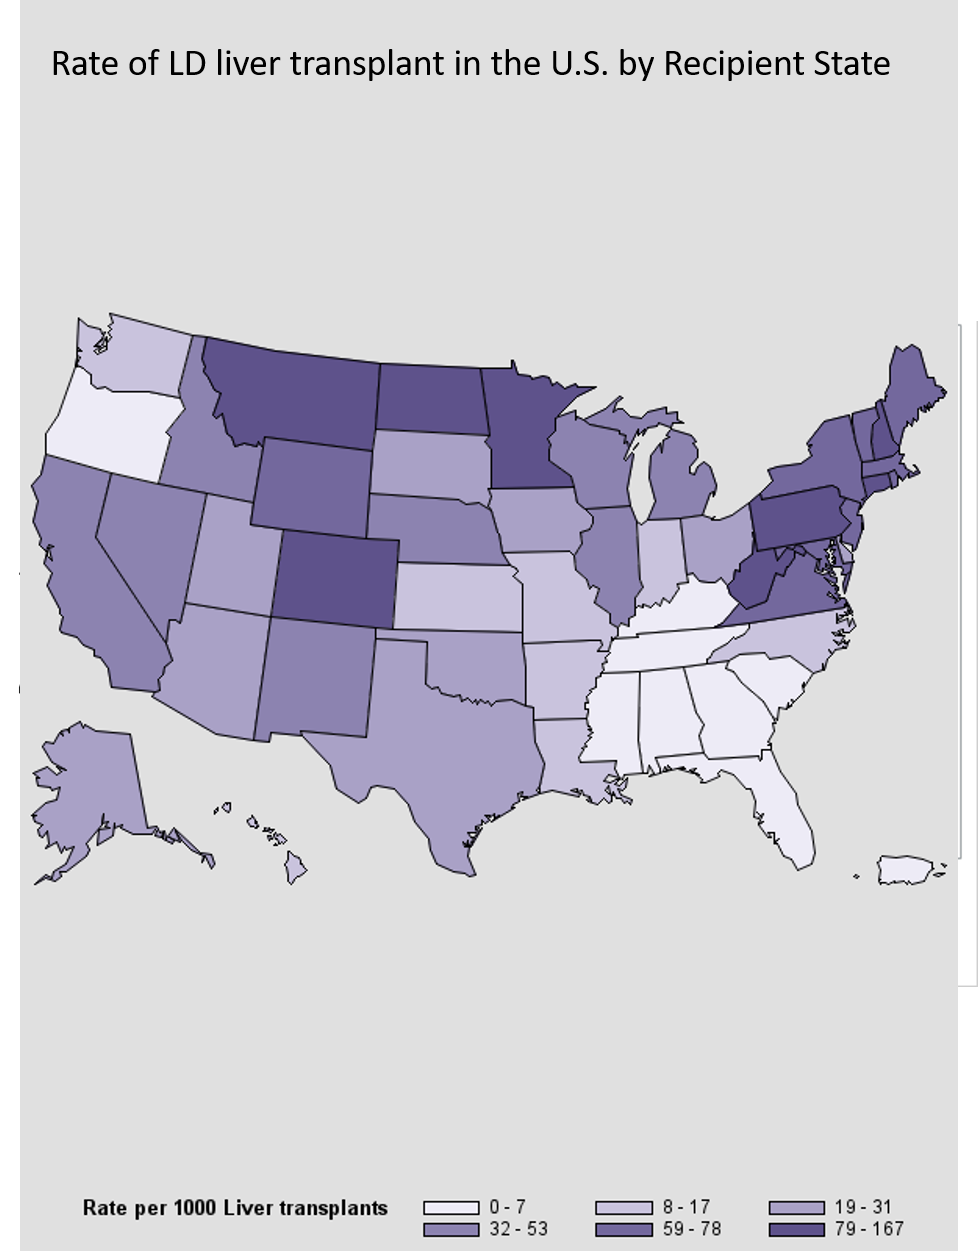
*Methods: Using 2013-2017 data from the Scientific Registry of Transplant Recipients we examined characteristics of 32,547 adult liver transplant recipients with primary residence (PR) data available. This data was geographically matched using the recipient’s PR to the 2017 American Community Survey. We examined demographic, community SES (poverty, education, insurance, employment), and geographic location among LDT and deceased donor (DD) recipients. Logistic regression was completed to assess the strongest predictors of LDT. To examine if PR impact the odds of LDT, the rate of LDT per 1000 liver transplants by recipient state was calculated.
*Results: 3.83% of US adult liver transplants during 2013-2017 were LDT (n=1245; DD n=31302). Compared to DD, LDT recipients had a lower average meld (15.3±5.4 vs 22.9±11.2), further distance to center (49 miles [IQR:16,135] vs 35 miles [IQR:13,104]), longer median time on the waitlist (154 days [80,320] vs 101 days [IQR:17,307]), a greater proportion were white (93% vs 86%), and female (46% vs 34%). As for SES, more LDT recipients were working for income 29% vs 16%, and more LDT had education above high school (64% vs 52%). LDT tended to come from communities with less poverty (12% vs 14%) and higher percentage of the community with private insurance (75% vs 69%). In a multivariable logistic regression, we found being white, female, non-diabetic, higher education, lower meld and coming from a community with higher levels of private insurance significantly (p<0.001) increased the odds of LDT. The rate of LDT varied significantly across states. We observed a highest rate of LDT in the Northeast as compared to the South.
*Conclusions: There are statistically significant differences in the geographic and SES factors in those patient who receive LD vs DD liver transplants. Additionally, we found that the rate of LDT varied significantly across states. The reasons for these differences could include distance to LDT centers, ability to travel, awareness and understanding of LDT options and availability of suitable donors. Further analysis should be done to determine what efforts may improve these disparities.
To cite this abstract in AMA style:
Jorgensen DR, Humar A, Hughes C, Molinari M, Ganoza A, Ganesh S, Duarte-Rojo A, Tevar A. Rates of Live Donor Liver Transplantation Vary by Socioeconomic Status and Geography [abstract]. Am J Transplant. 2020; 20 (suppl 3). https://atcmeetingabstracts.com/abstract/rates-of-live-donor-liver-transplantation-vary-by-socioeconomic-status-and-geography/. Accessed February 4, 2026.« Back to 2020 American Transplant Congress

