Paradoxical Liver Simulated Allocation Model (LSAM) Projections for Changes to Waitlist Mortality under Acuity Circle Distribution Model
1Emory, Atlanta, GA, 2Vanderbilt, Nashville, TN
Meeting: 2019 American Transplant Congress
Abstract number: D356
Keywords: Allocation, Liver transplantation
Session Information
Session Name: Poster Session D: Late Breaking
Session Type: Poster Session
Date: Tuesday, June 4, 2019
Session Time: 6:00pm-7:00pm
 Presentation Time: 6:00pm-7:00pm
Location: Hall C & D
*Purpose: In December 2018, the United Network for Organ Sharing (UNOS) board voted to change liver transplant distribution from Donor Service Areas (DSAs) to a system of concentric circles around donor hospitals. During policy development and review, the Scientific Registry of Transplant Recipients Liver Simulated Allocation Model (SRTR LSAM) software was used to estimate changes to various liver transplant system parameters. We sought to compare projections of changes to waitlist mortality with contemporary observed data.
*Methods: SRTR data on all adult liver transplant candidates and recipients from 1/1/10-12/31/16 was entered into the LSAM program, with outputs including changes to DSA-level liver transplant volume and waitlist deaths. All adult, non-exception listings who did not receive a transplant for 90 days to 1 year after listing between 1/1/10 and 12/31/15 were compiled by listing MELD and DSA. Multivariable logistic regression was used to create parsimonious models of waitlist survival at two timepoints.
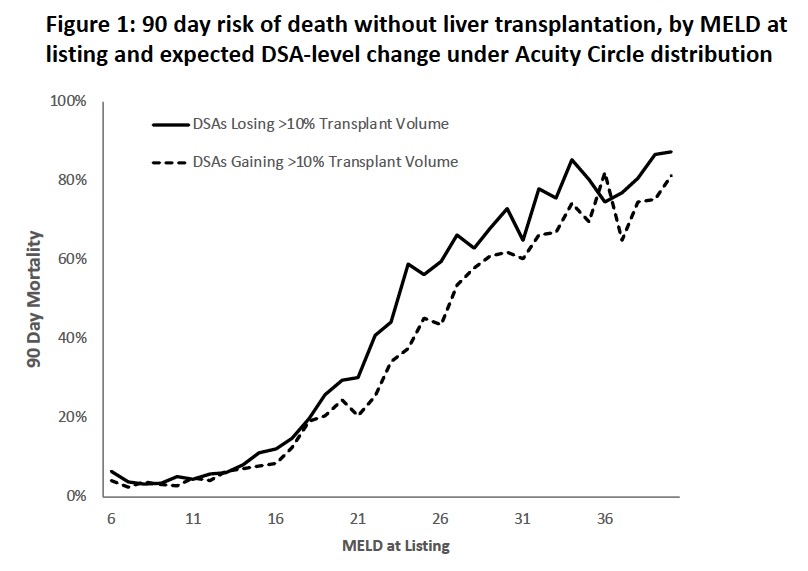
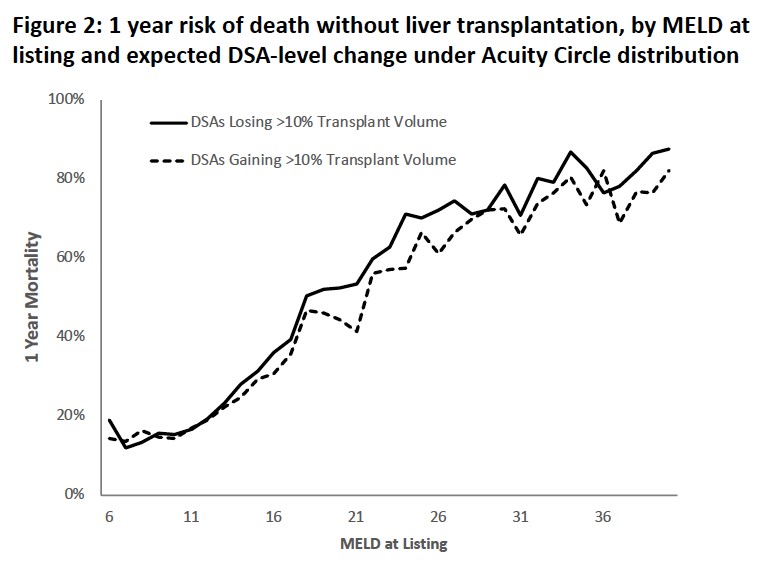
*Results: DSAs were ranked by LSAM-projected percent change in liver transplant volume under the Acuity Circle model. Among 26 DSAs with an expected decrease of 10% or greater in transplant volume (net loss 807 livers, -29% change), LSAM predicted 10 excess waitlist deaths. Among 11 DSAs gaining 10% or more (net gain 605 livers, +35%), LSAM predicted 121 waitlist deaths. These projections are at odds with observed patterns of waitlist mortality as shown at 90 days (Figure 1) and 1 year (Figure 2) after waitlisting. In each timepoint, observed data and regression modelling showed higher risk of death across 31 out of 35 MELD scores. Areas with higher existing waitlist mortality but under-represented risk by LSAM comprised 37% of new waitlist additions in 2018.
*Conclusions: LSAM projections for changes to waitlist deaths do not correlate with expected loss of organs from areas of already-higher waitlist mortality. Polices aimed at equalization of MELD scores at transplantation without consideration of heterogeneity in MELD’s predictive value pose potentially grave risks to a large portion of the waitlist.
To cite this abstract in AMA style:
Lynch R, Ross K, Karp S. Paradoxical Liver Simulated Allocation Model (LSAM) Projections for Changes to Waitlist Mortality under Acuity Circle Distribution Model [abstract]. Am J Transplant. 2019; 19 (suppl 3). https://atcmeetingabstracts.com/abstract/paradoxical-liver-simulated-allocation-model-lsam-projections-for-changes-to-waitlist-mortality-under-acuity-circle-distribution-model/. Accessed February 9, 2026.« Back to 2019 American Transplant Congress


