MELD Trajectory Prior to Death on the Liver Waitlist
Johns Hopkins School of Medicine, Baltimore, MD
Meeting: 2013 American Transplant Congress
Abstract number: 193
The trajectory of the MELD score prior to death in patients who die on the liver transplant waitlist has not previously been explored. Better understanding patterns that occur just prior to waitlist death might help identify and prioritize patients at high risk for a "downward spiral".
We analyzed 42,192 MELD values reported to UNOS in the 365 days prior to death for 11,885 waitlisted adults, excluding exceptions/Status 1, who died between 3/2002-2/2010. We estimated percent change in MELD score over time using random-intercept longitudinal models.
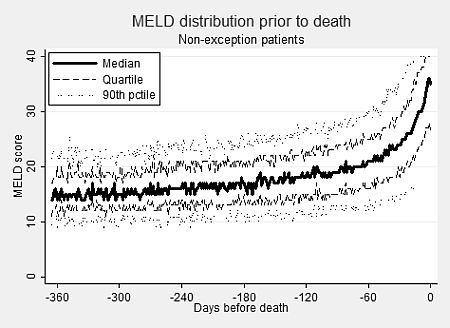
Median (IQR) MELD was 14(12-20) at 365 days prior to death (DPD), climbing gradually to 21.5 (17-26) at 30 DPD (Figure 1). It then rose sharply to 30 (24-37) at 10 DPD and 35 (26-40) on the date of death. An individual's MELD increased weekly by average 0.38% (95% CI 0.37%-0.39%) from 365 DBD to 60 DBD, 3.5% (3.3%-3.6%) from 60 DBD to 28 DBD, 7.0% (6.7-7.3%) from 28 DPD to 7 DPD, and 14.0% (13.1%-14.9%) in the week before death. The proportion of patients with MELD=40 was 13.3% at 14 DPD, 19.5% at 7 DPD, and 33.9% on the date of death.

MELD increases gradually in the year prior to death, then increases sharply at an exponential rate in the last month of life, and at an even higher exponential rate in the last week. MELD trajectory may be useful in identifying patients at high risk of a downward spiral not reflected by current MELD score.
To cite this abstract in AMA style:
Massie A, Segev D. MELD Trajectory Prior to Death on the Liver Waitlist [abstract]. Am J Transplant. 2013; 13 (suppl 5). https://atcmeetingabstracts.com/abstract/meld-trajectory-prior-to-death-on-the-liver-waitlist/. Accessed July 18, 2025.« Back to 2013 American Transplant Congress
