Liver Circle-Based Allocation: LSAM Modeling Results
1SRTR, Minneapolis, MN, 2Stanford Univ, Stanford, CA, 3Univ of Minnesota, Minneapolis, MN, 4Mayo Clinic, Rochester, MN
Meeting: 2019 American Transplant Congress
Abstract number: C299
Keywords: Donation, Graft acceptance, Procurement, Public policy
Session Information
Session Name: Poster Session C: Liver: MELD, Allocation and Donor Issues (DCD/ECD)
Session Type: Poster Session
Date: Monday, June 3, 2019
Session Time: 6:00pm-7:00pm
 Presentation Time: 6:00pm-7:00pm
Location: Hall C & D
*Purpose: On June 25, 2018, the OPTN Board of Directors (BOD) directed the Liver and Intestinal Organ Transplantation Committee to propose changes to policy removing DSA and region as units of allocation. At the Committee’s request, we modeled two allocation frameworks and estimated median MELD/PELD at transplant and percentage of organs flown by DSA, comparing results with current allocation policy and the December 2017 BOD-approved policy.
*Methods: The LSAM modelled deceased donor liver candidates, July 1, 2013-Jun 30, 2016, 10 times for each scenario. In the acuity circle (AC) framework, organs are offered first to status 1A, then 1B candidates in the largest circle (500 or 600 miles), then to candidates in expanding concentric circles around the donor hospital, by descending MELD groupings. In the broader 2-circle (B2C) distribution framework, organs are offered first to status 1A, then 1B candidates in the largest circle (500 miles), then to candidates with MELD ≥35 (or 32) within a 250-mile circle.
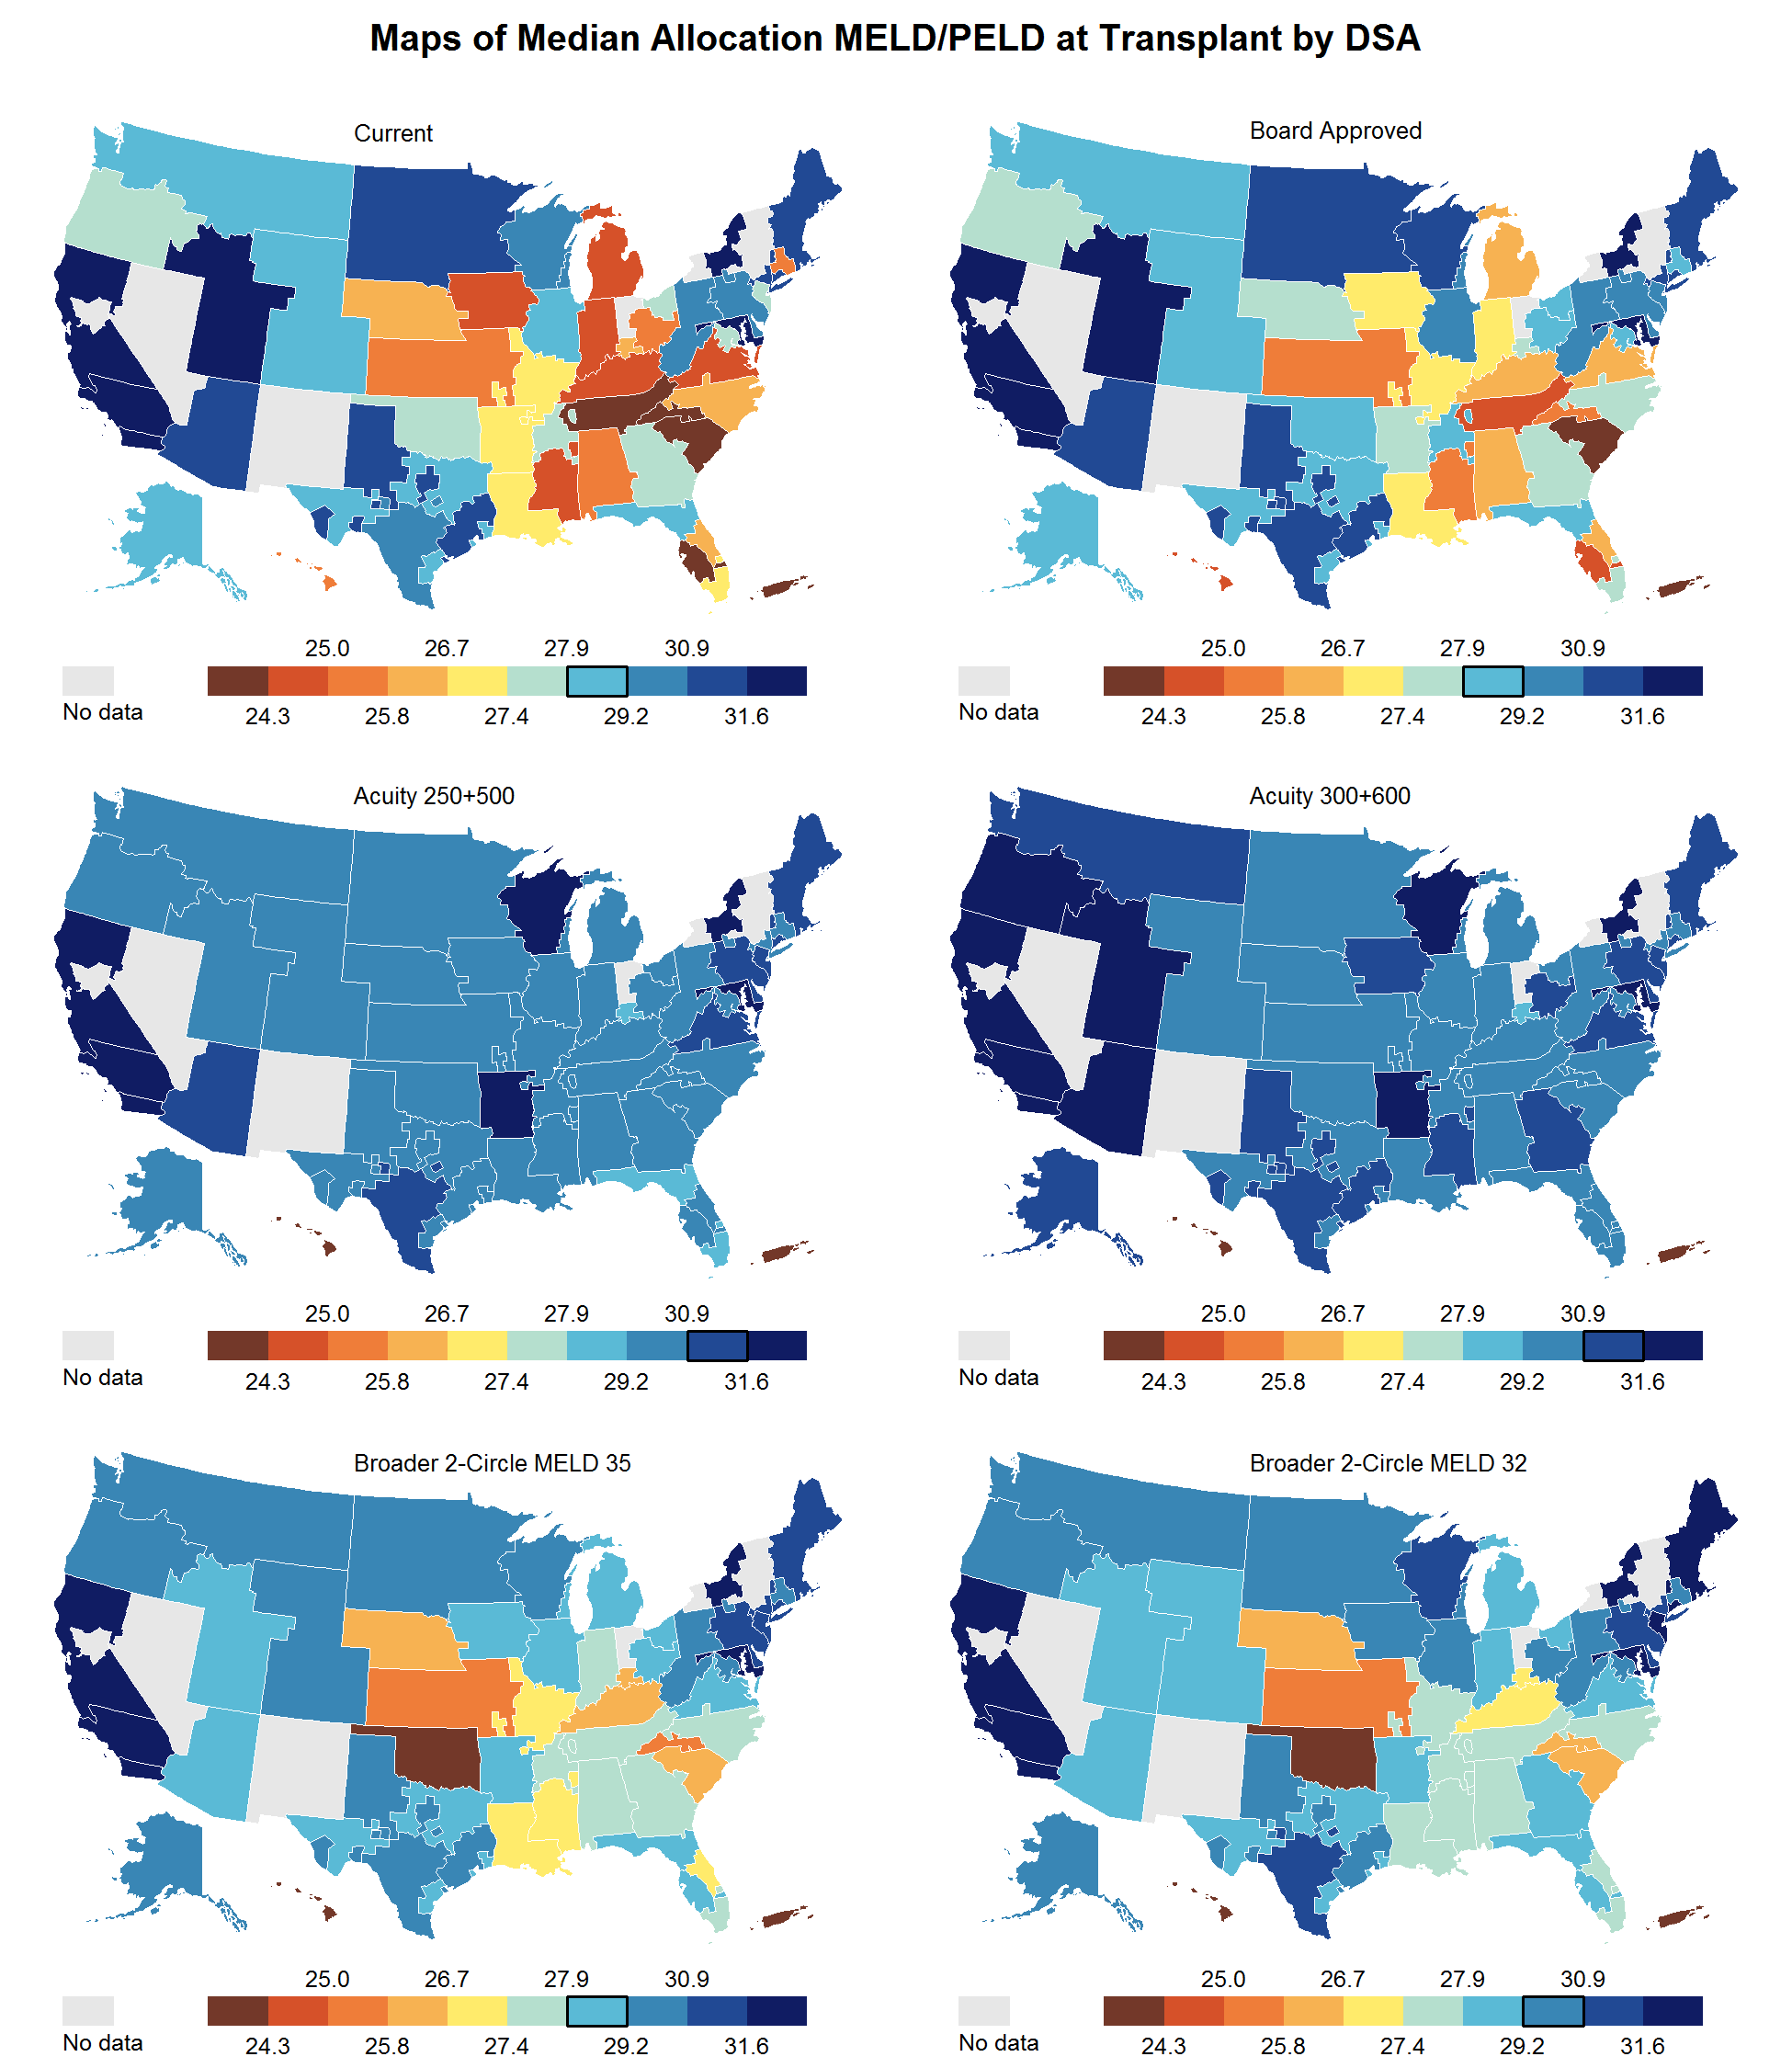
*Results: Both scenarios decreased variance in median MELD at transplant by DSA compared with current policy (Figure 1). B2C scenario results were similar to the BOD-approved policy; AC scenarios decreased variance further. Both scenarios increased the percentage of organs flown in most DSAs (Figure 2), with the greatest increase in the AC scenarios. Waitlist mortality rates in the B2C scenarios were higher than in the BOD-approved policy scenario, and lower in the AC scenarios; transplant rates were lowest in the AC scenarios.
*Conclusions: B2C scenarios yielded similar results to the BOD-approved policy. Magnitude of change was greater in AC scenarios than in B2C scenarios.
Figure 1. Median Allocation MELD/PELD at Transplant by DSA
Figure 2. Percentage of Organs Flown by Transplant DSA
To cite this abstract in AMA style:
Schladt D, Weaver T, Pyke J, Herreid A, Thompson B, Kasiske B, Snyder J, Kim W, Lake J, Israni A, Heimbach J. Liver Circle-Based Allocation: LSAM Modeling Results [abstract]. Am J Transplant. 2019; 19 (suppl 3). https://atcmeetingabstracts.com/abstract/liver-circle-based-allocation-lsam-modeling-results/. Accessed February 20, 2026.« Back to 2019 American Transplant Congress


