KDPI Obscures Trends in Absolute Donor Risk.
Scientific Registry of Transplant Recipients, Minneapolis, MN
Meeting: 2017 American Transplant Congress
Abstract number: A98
Keywords: Donation, Donors, Graft survival, Kidney transplantation, marginal
Session Information
Session Name: Poster Session A: Deceased Donor Issues I: Allocation, KDPI and Recipient Selection
Session Type: Poster Session
Date: Saturday, April 29, 2017
Session Time: 5:30pm-7:30pm
 Presentation Time: 5:30pm-7:30pm
Location: Hall D1
The kidney donor profile index (KDPI) is commonly used to measure deceased donor kidney quality based on the kidney donor risk index (KDRI) (Rao, et al. 2009). To calculate the KDPI, the Organ Procurement and Transplantation Network (OPTN) performs three operations. First, the donor-specific elements of the KDRI are applied to generate a measure of donor risk. Second, the donor-specific KDRI is rescaled so 1.0 is the median donor value. Third, the donor-specific KDRI is transformed to a percentile of donor risk (OPTN/UNOS, 2016). Rescaling and transforming the donor-specific KDRI can distort perceptions of donor risk.
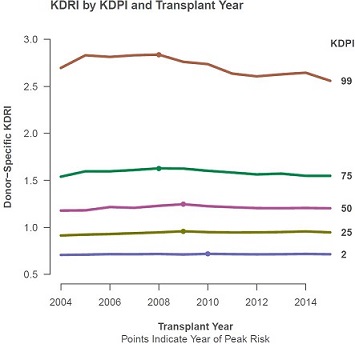
Rescaling KDPI obscures trends in median donor quality. Median KDRI increased from 2004 to 2009, peaking at 1.25, then decreased from 2009 to 2015. In 2015, the median donor risk was over 3% lower than in 2009. Calculating the risk percentile for each cohort also obscures temporal trends. The donor-specific KDRI for a KDPI 99 kidney in 2008 was 3.00. In 2015, it was 2.69, over 10% lower.
Transforming KDRI to a percentile scale also distorts the perception of donor risk and risk of posttransplant graft survival. Every 20-point change in value on the percentile scale is not the same on the absolute risk scale. In 2015, a 20-point shift from KDPI 36 to 16 would represent a 17.3% reduction in risk, but a shift from KDPI 99 to 79 would represent a 36.7% reduction in risk, according to the original KDRI values.
When evaluating kidney donor risk, the original KDRI is better than the scaled KDRI and KDPI. Alternatively, KDRI could be combined with a standard recipient profile to show how differences in donor quality affect predicted graft survival. Figure 1 shows the donor-specific KDRI for 5 KDPI values 2004-2015. Peak donor risk was from 2008 to 2010 for all 5 KDPI values shown. References
PS Rao, DE Schaubel, MK Guidinger, et al. A comprehensive risk quantification score for deceased donor kidneys: the kidney donor risk index. Transplantation. 2009:88:231-236.
OPTN/UNOS. 2016. A guide to calculating and interpreting the kidney donor profile index (KDPI). https://optn.transplant.hrsa.gov/media/1512/guide_to_calculating_interpreting_kdpi.pdf Accessed October 28, 2016.
CITATION INFORMATION: Salkowski N, Gustafson S, Wey A, Snyder J. KDPI Obscures Trends in Absolute Donor Risk. Am J Transplant. 2017;17 (suppl 3).
To cite this abstract in AMA style:
Salkowski N, Gustafson S, Wey A, Snyder J. KDPI Obscures Trends in Absolute Donor Risk. [abstract]. Am J Transplant. 2017; 17 (suppl 3). https://atcmeetingabstracts.com/abstract/kdpi-obscures-trends-in-absolute-donor-risk/. Accessed February 16, 2026.« Back to 2017 American Transplant Congress
