Increasing Survival on the Kidney Transplant Waiting List: A Thirty-Three Year Analysis
1Baylor College of Medicine, Houston, TX, 2Division of Abdominal Transplantation, Department of Surgery, Baylor College of Medicine, Houston, TX
Meeting: 2021 American Transplant Congress
Abstract number: 105
Keywords: Kidney, Outcome, Survival, Waiting lists
Topic: Clinical Science » Public Policy » Non-Organ Specific: Public Policy & Allocation
Session Information
Session Name: Potpourri of Public Policy and Allocation
Session Type: Rapid Fire Oral Abstract
Date: Sunday, June 6, 2021
Session Time: 4:30pm-5:30pm
 Presentation Time: 4:40pm-4:45pm
Location: Virtual
*Purpose: The shortage of available donor kidneys remains the greatest obstacle to transplantation, with many patients spending years on the transplant list. During this time, dialysis and comorbidity management are the standard of care. Given numerous improvements in dialysis and medical management, we sought to evaluate survival on the kidney waiting list across the modern era of transplantation. We hypothesized that survival on the waiting list has increased over time, despite increased presence of comorbid risk factors over the last three decades.
*Methods: A retrospective cohort study was conducted of all adults (at least 18 years of age) listed for kidney transplant along between 1984 and 2017 in the OPTN STAR files. Single and multivariable competing risk, Kaplan-Meier survival, and Cox regression analyses were performed to assess the relationship between listing era, patient characteristics and risk factors, and the primary outcome of death prior to transplantation – measured as waiting list death or disease progression resulting in delisting.
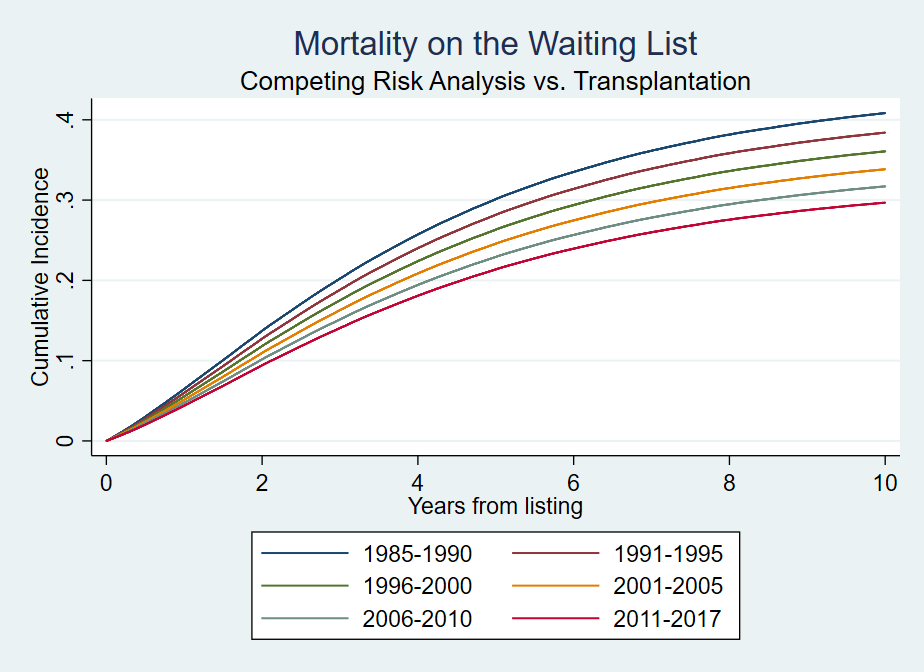
*Results: A total of 734,665 listed candidates were identified. Candidate BMI at listing increased from 24.6 in 1984-1990 to 28.1 in 2011-2017, and age from 41.2 years to 51.6. Frequency of comorbid diabetes increased from 14.6% to 42.3%, and more patients are on dialysis at the time of listing – 75.1% in the 2011-2017 era, compared to 66.1% in the 1996-2000 era. Fewer individuals are receiving transplants (57.1% in 2006-10 vs 66.5% in 1984-90) and time spent on the waiting list has increased to1039 days in 2006-10 from 660 days in 1984-90. Despite these changes, survival on the waiting list over time has increased in each successive era in single and multivariable Cox and competing risk analysis (HR = 0.857 for era, 95% CI 0.831 – 0.883). This is the case across all risk sub-groups and diagnoses, with the exception of the small number of individuals listed in poor functional status.
*Conclusions: This analysis demonstrates an increase in survival on the kidney waiting list over the past three and a half decades, despite an increase in risk factors for mortality among the candidates listed in the same period.
| Era | 1984-1990 | 1991-1995 | 1996-2000 | 2001-2005 | 2006-2010 | 2011-2017 |
| Candidate age | 41.3 ± 12.8 | 44.0± 13.0 |
47.0± 13.2 |
49.0± 13.5 |
50.9± 13.5 |
51.6± 13.7 |
| Body Mass Index (BMI) | 24.9 ±5.8 | 25.5 ±5.5 | 26.5 ± 5.6 | 27.4 ± 5.7 | 28.3 ± 5.7 | 28.8 ± 5.6 |
| % with Diabetes | – | 26.7 | 30.6 | 35.4 | 40.1 | 42.3 |
| % on Dialysis at Listing | 0.5 | 5.01 | 66.0 | 80.4 | 76.0 | 75.1 |
| Days on the List (mean ± SD) | 660 ± 904 | 749 ± 896 | 914 ± 944 | 955 ± 938 | 1039 ± 889 | 733 ± 590* (reduced due to f/u time) |
| % Transplanted | 66.5 | 68.6 | 64.0 | 61.3 | 57.1 | 40.0* |
| % Died Prior to Transplantation | 10.5 | 13.5 | 18.4 | 16.9 | 15.1 | 7.3* |
To cite this abstract in AMA style:
Godfrey EL, Kambhampati PT, Goss JA, Rana A. Increasing Survival on the Kidney Transplant Waiting List: A Thirty-Three Year Analysis [abstract]. Am J Transplant. 2021; 21 (suppl 3). https://atcmeetingabstracts.com/abstract/increasing-survival-on-the-kidney-transplant-waiting-list-a-thirty-three-year-analysis/. Accessed July 12, 2025.« Back to 2021 American Transplant Congress

