Extremes of Body Mass Index is Associated with Inferior Renal Allograft Outcomes in Type 2 Diabetic Deceased Donor Renal Transplant Recipients
A. Brar, A. Gruessner, F. Tedla, R. Gruessner, J. Renz, N. Sumrani, D. John, M. O. Salifu
SUNY Downstate Medical Center, Brooklyn, NY
Meeting: 2019 American Transplant Congress
Abstract number: 327
Keywords: Kidney, Metabolic disease, Obesity, Outcome
Session Information
Session Name: Concurrent Session: Kidney: Cardiovascular and Metabolic II
Session Type: Concurrent Session
Date: Monday, June 3, 2019
Session Time: 4:30pm-6:00pm
 Presentation Time: 5:18pm-5:30pm
Location: Ballroom C
*Purpose: We evaluated the trends and renal allograft outcomes in type 2 diabetic renal transplant recipients stratified by body mass index (BMI).
*Methods: All adult type 2 diabetics primary solitary kidney transplants performed between 2008 and 2017 reported to the UNOS/OPTN database were analyzed. This included 10616 living donor (LD) and 30992 deceased donor (DD) renal transplants. Renal allograft survival rates were computed according to Kaplan-Meier and Cox proportional hazards were used to estimate the impact of potential influential variables.
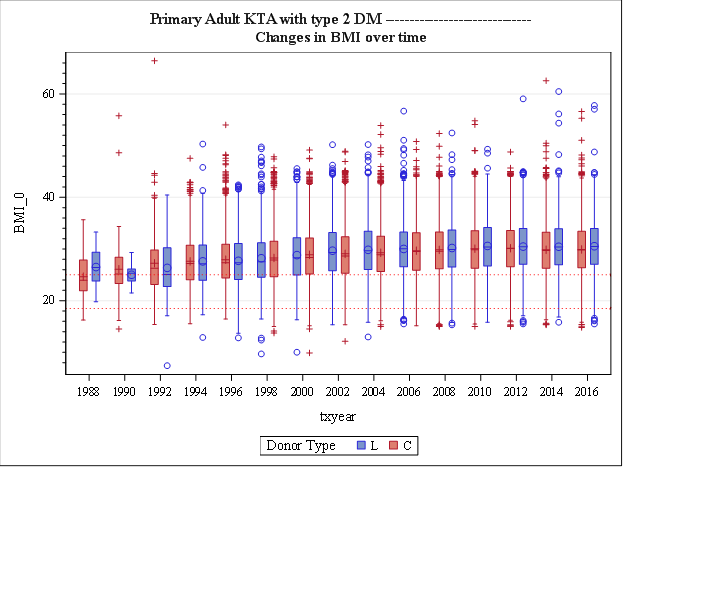
*Results: Proportion of obese diabetic renal transplant recipients increased to 49.6% in 2013-2017 from 16.8% in 1987-1992, p=0.0001. Figure 1 shows the changes in BMI over time in type 2 diabetic renal transplant recipients separated by donor type. In this cohort, 6702 (15.7%) had normal BMI, 207(0.48%) were underweight and 14636 (34.2%) were overweight. Class 1 obesity defined as BMI 30-34.9 kg/m2; 13825 (32.4%), class 2 obesity defined as BMI 35-39.9 6 kg/m2; 270 (14.7%) and class 3 obesity BMI > 40 kg/m2; 1048 (2.46%) was observed. Fifty-three percent women (7456) and forty-seven percent men (13,687) were obese, p=0.001.Of note, 56.3% whites, 51.2% blacks, 41.9% Hispanics and 24% Asian recipients were obese, p=0.0001. Rates of delayed graft function (DGF) were highest in class 3 obesity (43.7%) compared to class 2 obesity (36.6%), class 1 obesity (34.3%), overweight (30.7%), normal (28.2%) and underweight (23.4%), p=0.0001. One year, 3 yrs. and 5 yrs. survival in DD were lowest in underweight (87.1%, 70.5%, 60.3%) followed by class 3 obesity (89.8%, 78.1%, and 66.2%). Allograft survival was not statistically different between other BMI groups. No difference in renal allograft survival was seen in LD recipients stratified by BMI.
*Conclusions: Higher rates of DGF were observed in class 3 obese diabetic renal transplant recipients. No difference in renal allograft survival was seen in LD recipients stratified by BMI but in DD recipients renal allograft survival was lowest in underweight followed by class 3 obese as compare to normal BMI recipients.
To cite this abstract in AMA style:
Brar A, Gruessner A, Tedla F, Gruessner R, Renz J, Sumrani N, John D, Salifu MO. Extremes of Body Mass Index is Associated with Inferior Renal Allograft Outcomes in Type 2 Diabetic Deceased Donor Renal Transplant Recipients [abstract]. Am J Transplant. 2019; 19 (suppl 3). https://atcmeetingabstracts.com/abstract/extremes-of-body-mass-index-is-associated-with-inferior-renal-allograft-outcomes-in-type-2-diabetic-deceased-donor-renal-transplant-recipients/. Accessed February 22, 2026.« Back to 2019 American Transplant Congress

