Demographic and Geographic Differences in the Proportion of Liver Disease Deaths Captured by the Transplant Waitlist in the United States, 2011 – 2015
1Department of Epidemiology, Rollins School of Public Health, Atlanta, GA
2Emory Transplant Center, Atlanta, GA
3Perelman School of Medicine, University of Pennsylvania, Philadelphia, PA.
Meeting: 2018 American Transplant Congress
Abstract number: 370
Keywords: Allocation, Liver transplantation, Mortality, Public policy
Session Information
Session Name: Concurrent Session: Non-Organ Specific: Economics, Public Policy, Allocation, Ethics - 1
Session Type: Concurrent Session
Date: Monday, June 4, 2018
Session Time: 4:30pm-6:00pm
 Presentation Time: 5:42pm-5:54pm
Location: Room 4C-4
Background: There are no population-based estimates of the prevalence of end-stage liver disease in the United States, creating challenges in measuring disease burden to inform allocation policy. Proxy measures often used include the transplant waitlist and population mortality. We calculated the proportion of liver disease deaths in the population that were captured by the transplant waitlist by demographic and geographic factors.
Methods: Data on the liver transplant waitlist is from the Scientific Registry of Transplant Recipients; population mortality is from CDC WONDER. Inclusion criteria was death from liver disease between 2011 and 2015. Deaths after age 75 were excluded. The proportion of deaths captured by the waitlist was calculated as the number of waitlisted candidates who died over the number of deaths in the population. Demographics included age, race, gender, and state; differences between groups were assessed using Chi-square tests.
Results: From 2011 – 2015, there were 202,938 deaths from liver disease in the U.S.; 13,415 were captured by the transplant waitlist (6.6%). There were significant differences in the proportion of deaths captured by the waitlist by race, gender, age, and state (p < 0.001 for all). Asians were most likely to have their death captured by the waitlist (19.5%); American Indians were least likely (2.5%). Lower proportions were captured in the South and Northwest and higher proportions were captured in the Northeast. 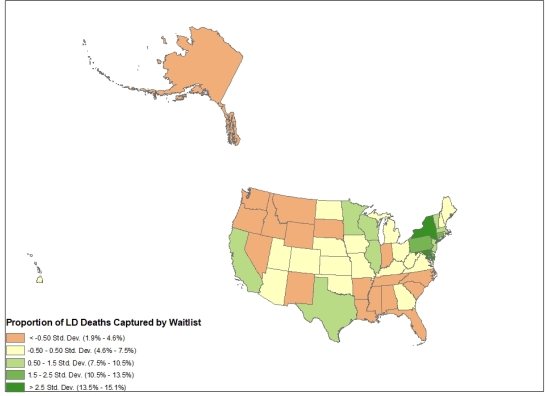
Discussion: The proportion of liver disease deaths captured by the waitlist is low and varies by demographics and geography. Using the waitlist to measure liver disease prevalence may differentially underestimate population disease burden. Although not all patients are transplant candidates, the low proportion of deaths captured on the waitlist among those who ultimately died of liver disease indicate potential missed opportunities for referral to transplant.
CITATION INFORMATION: Ross K., Lynch R., Goldberg D., Patzer R. Demographic and Geographic Differences in the Proportion of Liver Disease Deaths Captured by the Transplant Waitlist in the United States, 2011 – 2015 Am J Transplant. 2017;17 (suppl 3).
To cite this abstract in AMA style:
Ross K, Lynch R, Goldberg D, Patzer R. Demographic and Geographic Differences in the Proportion of Liver Disease Deaths Captured by the Transplant Waitlist in the United States, 2011 – 2015 [abstract]. https://atcmeetingabstracts.com/abstract/demographic-and-geographic-differences-in-the-proportion-of-liver-disease-deaths-captured-by-the-transplant-waitlist-in-the-united-states-2011-2015/. Accessed April 4, 2026.« Back to 2018 American Transplant Congress