Continuous Improvement in Long Term Survival of Kidney Transplants Over the Past Two Decades
1Nephrology, Cleveland Clinic, Cleveland, OH, 2Quantitative Health Sciences, Cleveland Clinic, Cleveland, OH, 3Urology, Cleveland Clinic, Cleveland, OH, 4Nephrology, Johns Hopkins, Baltimore, MD
Meeting: 2020 American Transplant Congress
Abstract number: 350
Keywords: Graft survival, Kidney transplantation, Outcome, Survival
Session Information
Session Name: Kidney Complications: Non-Immune Mediated Late Graft Failure
Session Type: Oral Abstract Session
Date: Saturday, May 30, 2020
Session Time: 3:15pm-4:45pm
 Presentation Time: 3:39pm-3:51pm
Location: Virtual
*Purpose: Short-term kidney transplant (KTx) graft survival has improved during past decades, but prior research has indicated stagnation or minimally improving long-term outcomes. We studied 1- 5- and 10-year graft survival and calculated the observed and projected half-life in deceased donor (DD) and living donor (LD) KTx from ’95 to date.
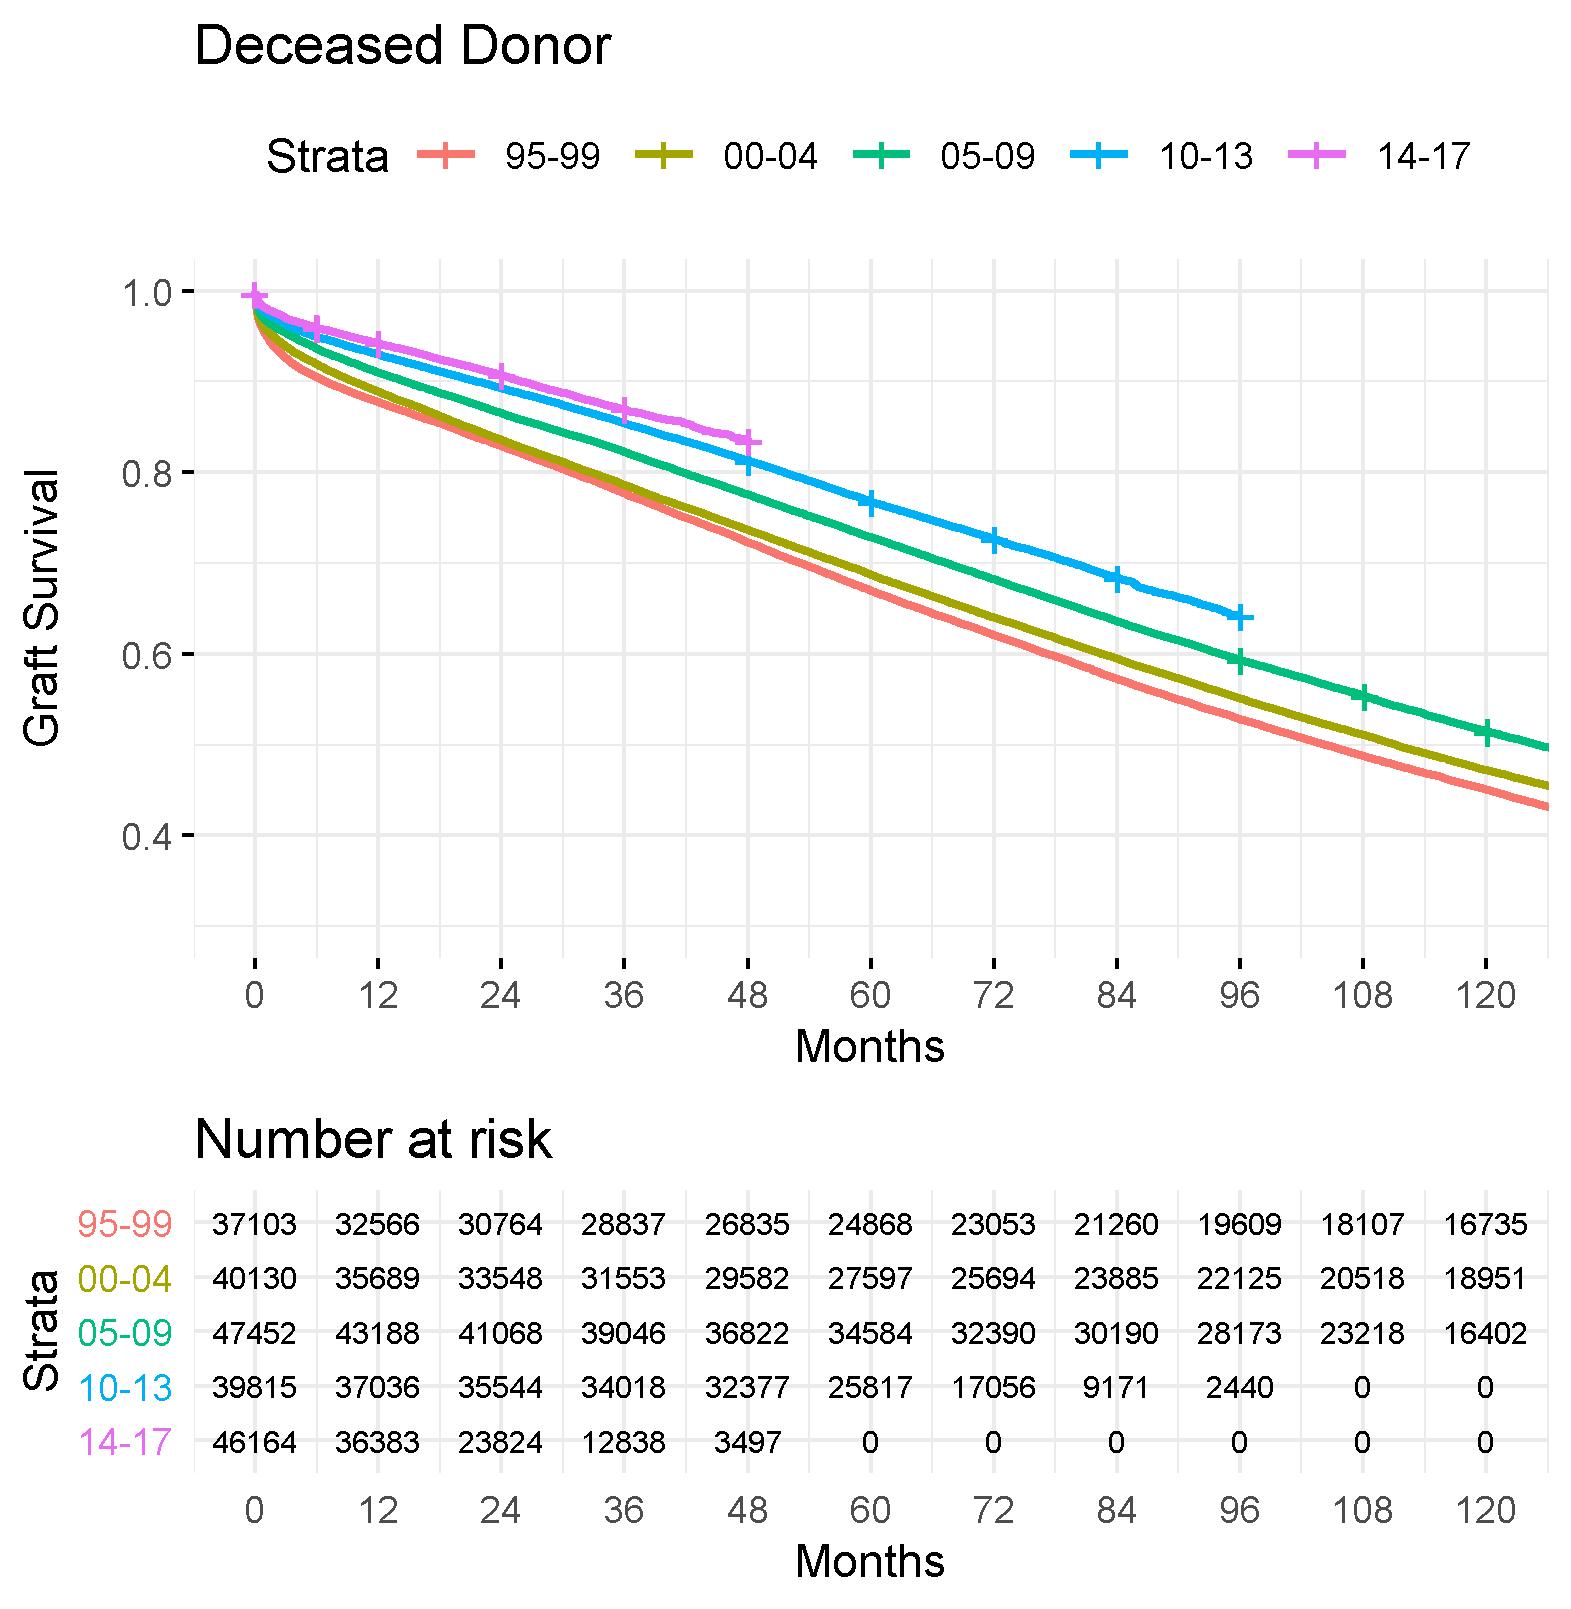
*Methods: We examined the SRTR for all DD and LD adult KTx b/w 01/01/95 and 12/01/17. The cohort was grouped by eras spanning 4-5 yrs. We estimated Kaplan-Meier graft survival and for eras where median survival has not yet been observed, we fitted linear regression models to estimate half-lives.
*Results: 331,214 KTx were included, with 63.6% DD (n=210,664) and 36.4% LD (n=120,550). Age was 49.4 (13.7) yo and 39.7% were female. Observed DD half-life increased from 104 mo in era ’95-’99 to 125 mo in era ’05-’09 (p<0.001). The projected (* in tables) half-life for DD KTx b/w '14-'17 is 154 mo. In LDs, observed half-life increased from 164 mo in era '95-'99 to 174 mo in era '00-'04 (p<0.001). Projected half-life for LD KTx b/w '14-'17 is 279 mo. KM graphs show continuous improvement of long-term graft survival era by era.
*Conclusions: While short-term graft survival continues to improve, significant improvement in long-term survival is now occurring with expected current half-life in LDs exceeding 20 yrs and in DDs 13 yrs.
| Era | N | 12 mo | 60 mo | 120 mo | Half-Life |
| 1995-1999 | 37,103 | 87.8 | 67.0 | 45.1 | 104 |
| 2000-2004 | 40,130 | 88.9 | 68.8 | 47.2 | 111 |
| 2005-2009 | 47,452 | 91.0 | 72.9 | 51.5 | 125 |
| 2010-2013 | 39,815 | 93.0 | 76.8 | 136* | |
| 2014-2017 | 46,164 | 94.3 | 154* |
| Era | N | 12 mo | 60 mo | 120 mo | Half-Life |
| 1995-1999 | 18,183 | 94.0 | 80.2 | 61.5 | 164 |
| 2000-2004 | 28,780 | 94.8 | 81.5 | 63.5 | 174 |
| 2005-2009 | 29,711 | 96.1 | 84.7 | 68.0 | 188* |
| 2010-2013 | 22,245 | 97.1 | 86.9 | 214* | |
| 2014-2017 | 21,631 | 97.9 | 279* |
To cite this abstract in AMA style:
Poggio ED, Arrigain S, Wee A, Brennan DC, Schold JD. Continuous Improvement in Long Term Survival of Kidney Transplants Over the Past Two Decades [abstract]. Am J Transplant. 2020; 20 (suppl 3). https://atcmeetingabstracts.com/abstract/continuous-improvement-in-long-term-survival-of-kidney-transplants-over-the-past-two-decades/. Accessed February 22, 2026.« Back to 2020 American Transplant Congress


