Comparison of Actual versus Goal Tacrolimus Levels Post Cardiothoracic Transplant.
Vanderbilt Transplant Center, Nashville, TN.
Meeting: 2016 American Transplant Congress
Abstract number: B165
Keywords: FK506, Heart/lung transplantation, Immunosuppression, Monitoring
Session Information
Session Name: Poster Session B: Hearts and VADs in Depth - The Force Awakens
Session Type: Poster Session
Date: Sunday, June 12, 2016
Session Time: 6:00pm-7:00pm
 Presentation Time: 6:00pm-7:00pm
Location: Halls C&D
Background
Although target tacrolimus (TAC) trough levels necessary to prevent rejection are established post heart/lung transplant (tx), there is little published literature on the proportion of TAC levels that are within goal range.
Purpose
To examine the proportion of TAC assays within goal range and TAC variability following heart/lung tx.
Methods
We report a single-center retrospective study of adults who received a heart or lung tx between July 2013 and June 2014. All TAC assays obtained during the first year were labeled as below, within, or above goal. Records were reviewed to assess reasons for assays being out of range. Outcome measures were the proportion of assays within ±10% of goal range and the coefficient of variation (CV) of TAC levels. Data were summarized for each patient at 1, 1-3, and 4-12m, and were analyzed using summary statistics and Wilcoxon signed rank test.
Results
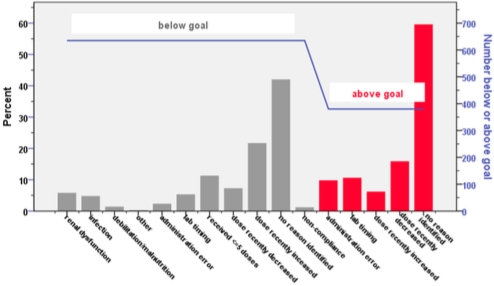
Thirty-six patients (20 heart, 16 lung) and 2018 TAC assays (1027 heart, 991 lung) were analyzed. Patients received 12±15 doses prior to first therapeutic level. Goal-related outcomes are reported in Table 1. Paired comparisons between months 1-3 and 4-12 showed a statistically significant increase in the proportion of assays within goal (p=0.041) and a reduction in the CV for TAC (p<0.001). Figure 1 displays reasons for assays being below (630) and above (380) goal.
Discussion
TAC remains a difficult drug to manage. This study demonstrated the proportion of TAC levels within goal range is lower than desired and is amenable to quality improvement efforts. As expected, TAC variability decreased as patients moved farther from tx, validating the utility of these metrics. A larger sample will allow correlation with rejection.
Table 1. Proportion of TAC Assays within ±10% of Goal and CV of TAC.
| Follow-Up | N | Min | Max | Mean |
| Proportion within ±10% of goal | ||||
| M1 M1-3 M4-12 |
36 34 32 |
0.04 0.22 0.29 |
0.77 0.67 0.91 |
0.46±0.15 0.48±0.12 0.54±0.17 |
| Coefficient of Variation (%) | ||||
| M1 M1-3 M4-12 |
36 34 32 |
25 27 2 |
95 82 14 |
50±17 48±13 5±2 |
Figure 1. Documented Reasons for Above or Below Goal TAC Levels

CITATION INFORMATION: Milas E, Feurer I, Truscott C, Gray J, Wilson N, Bala S, Dreher T, Wigger M, Steele M, Shah A, Lambright E, Hanto D. Comparison of Actual versus Goal Tacrolimus Levels Post Cardiothoracic Transplant. Am J Transplant. 2016;16 (suppl 3).
To cite this abstract in AMA style:
Milas E, Feurer I, Truscott C, Gray J, Wilson N, Bala S, Dreher T, Wigger M, Steele M, Shah A, Lambright E, Hanto D. Comparison of Actual versus Goal Tacrolimus Levels Post Cardiothoracic Transplant. [abstract]. Am J Transplant. 2016; 16 (suppl 3). https://atcmeetingabstracts.com/abstract/comparison-of-actual-versus-goal-tacrolimus-levels-post-cardiothoracic-transplant/. Accessed February 2, 2026.« Back to 2016 American Transplant Congress
