Characterizing the Dominant Phenotype in Kidney Transplant Biopsies: Improving the Prediction of Risk by a Global View of Rejection, Injury, and Atrophy-Fibrosis
1University of Alberta, Edmonton, AB, Canada, 2Alberta Transplant Applied Genomics Centre, Edmonton, AB, Canada
Meeting: 2019 American Transplant Congress
Abstract number: 363
Keywords: Gene expression, Kidney transplantation, Rejection, Survival
Session Information
Session Name: Concurrent Session: Biomarkers, Immune Monitoring and Outcomes III
Session Type: Concurrent Session
Date: Monday, June 3, 2019
Session Time: 4:30pm-6:00pm
 Presentation Time: 5:30pm-5:42pm
Location: Room 306
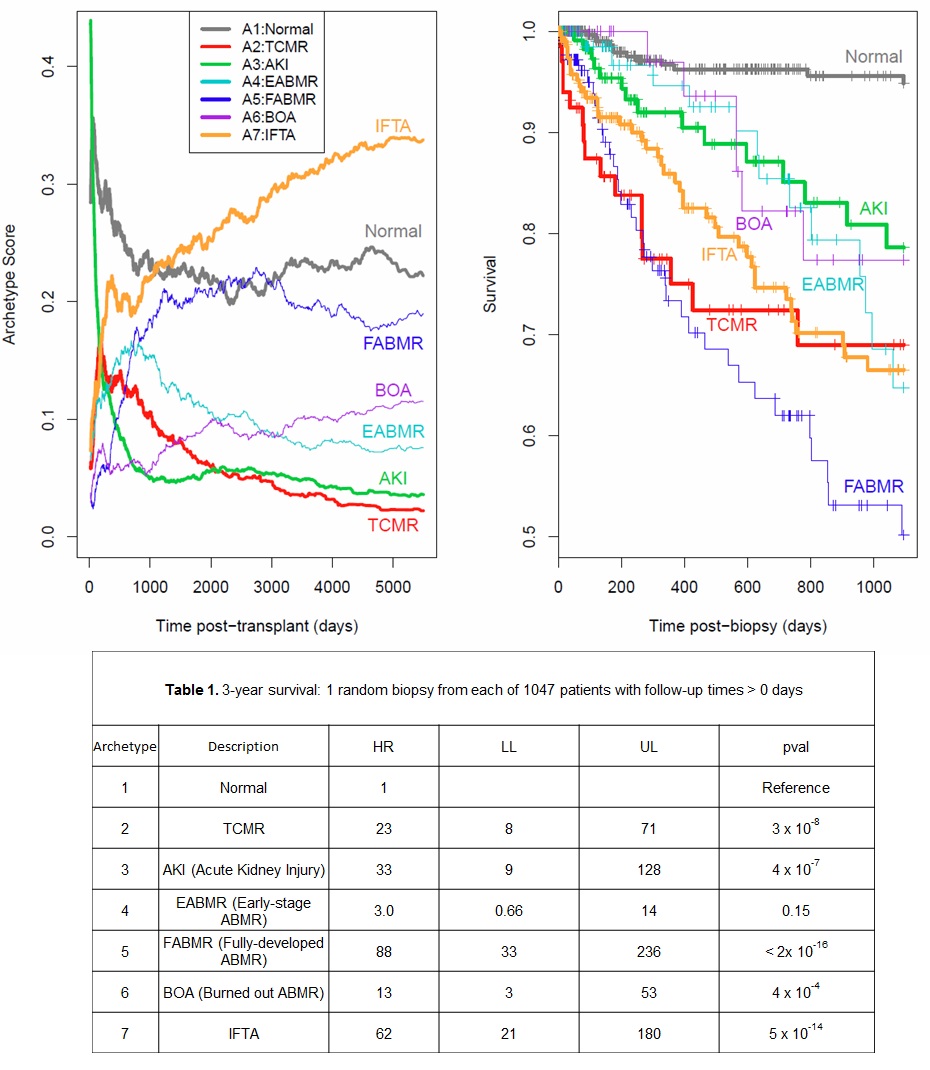
*Purpose: Interpreting kidney transplant biopsies by histology or molecules involves assigning scores for separate pathologic categories: rejection, acute injury (molecules only), and chronic parenchymal loss (atrophy-fibrosis). However, it would be useful to have a global assessment of the dominant phenotype. We performed unsupervised archetypal analysis of 1745 kidney transplant indication biopsies using transcripts selected for their relationships to rejection (ABMR, TCMR), AKI, and atrophy-fibrosis. We hypothesized that inclusion of rejection, injury, and fibrosis would generate a dominant rejection/injury/fibrosis (RIF) phenotype for each biopsy to supplement the assessment of separate pathologies.
*Methods: Indication biopsies from 22 centers were processed by histology and microarrays (INTERCOMEX ClinicalTrials.gov NCT01299168). Unsupervised analysis was used to assign 7 archetype scores to each of the biopsies. The scores add to 1.0, and the dominant phenotype is defined as the archetype with the highest score within each biopsy.
*Results: The RIF phenotypes were: 1) normal, 2) TCMR, 3) early injury/no scarring (AKI), 4) early-stage ABMR (EABMR), 5) fully-developed ABMR (FABMR), 6) late-stage inactive (burned out) ABMR (BOA), and 7) atrophy-scarring/no rejection (IFTA). The average archetype scores vs time post-transplant are plotted in Figure 1. Each biopsy was assigned to a group based on its highest score: Normal, N=566 (32%), TCMR, 138 (8%), AKI, 218 (12%), EABMR, 158 (9%), FABMR, 226 (13%), BOA, 76 (4%), and IFTA, 363 (21%). The main differences between RIF and our purely rejection-based phenotypes were in dividing EABMR into those with and without AKI, and those with late ABMR into active (FABMR) vs. inactive (BOA). These categories better reflect the relative risk of graft failure compared to normal kidneys (Figure 2).
*Conclusions: In addition to the usual biopsy phenotyping – enumerating individual classes of rejection and injury abnormalities – a parallel dominant phenotype classification can, when added to a pure rejection-based phenotyping system, more closely identify the actual risks of each biopsy, and has the advantage of identifying the most normal tissues. The RIF phenotype of “molecularly normal” identifies kidneys with excellent chance for long term survival, and in this sense is superior to previous estimates of relative risk of failure.
To cite this abstract in AMA style:
Reeve J. Characterizing the Dominant Phenotype in Kidney Transplant Biopsies: Improving the Prediction of Risk by a Global View of Rejection, Injury, and Atrophy-Fibrosis [abstract]. Am J Transplant. 2019; 19 (suppl 3). https://atcmeetingabstracts.com/abstract/characterizing-the-dominant-phenotype-in-kidney-transplant-biopsies-improving-the-prediction-of-risk-by-a-global-view-of-rejection-injury-and-atrophy-fibrosis/. Accessed February 8, 2026.« Back to 2019 American Transplant Congress

