Characteristics and Consequences of Renal Allograft Rejections Due to Nonadherence
S. Patel, S. Kuten, J. Everett, J. Loucks-DeVos, L. Gaber, A. Gaber, R. Knight.
Houston Methodist Hospital, Houston.
Meeting: 2015 American Transplant Congress
Abstract number: 460
Keywords: Psychosocial, Rejection, Renal injury, Risk factors
Session Information
Session Name: Concurrent Session: Kidney: Acute Cellular Rejection
Session Type: Concurrent Session
Date: Tuesday, May 5, 2015
Session Time: 4:00pm-5:30pm
 Presentation Time: 5:12pm-5:24pm
Location: Room 121-AB
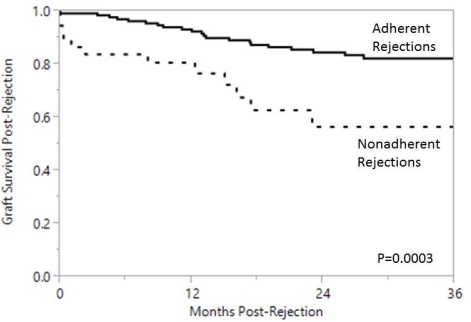
Non-adherence (NA) with immunosuppressive medications is associated with increased healthcare costs, rejection risk, and graft loss. NA is difficult to measure, however, and is often discovered after acute rejection (AR). The purpose of this study was to describe risk factors and outcomes following AR in renal transplant recipients with adherent and NA rejection episodes. We reviewed AR episodes over a 5 year period. NA was defined as completely missing medications or “occasionally skipping” medications with undetectable/erratic levels. Mean follow-up was 30±20 months post-AR. 37 of 173 (21%) ARs were identified as being due to NA. NA patients were younger (37 vs. 47 years; p<0.01) and more likely to have been on dialysis pre-transplant (94% vs. 78%; p=0.01). There were no differences in other baseline features including education level, pre-transplant psychosocial assessment scores, primary payer, or primary language. AR characteristics are shown in Table 1. ARs due to NA occurred later and were associated with higher creatinines at presentation. In addition, NA rejections were less likely to be borderline grade, and were more likely to be antibody-mediated, plasma-cell rich, donor-specific antibody-positive, and require antithymocyte globulin. Graft survival was significantly worse following NA rejections, with nearly 50% graft failure within 3 years of the AR episode. In conclusion, AR resulting from NA is associated with worse renal function and histology, a higher rate of DSA, and worse graft survival compared to rejections during adherence. Strategies to improve medication adherence in renal transplant recipients are vital to the preservation of long-term graft survival.
| Adherent (N=136) | Non-adherent (N=37) | ||
| Time from transplant (mos) | 9.2 | 19.7 | <0.01 |
| Pre-treatment Cr (mg/dL) | 2.6 | 4.7 | <0.01 |
| Rejection Grades | |||
| Borderline, n (%) | 42 (31) | 2 (5) | <0.01 |
| Grade 1, n (%) | 50 (37) | 25 (68) | <0.01 |
| Grade 2, n (%) | 27 (20) | 7 (19) | NS |
| Grade 3, n (%) | 5 (4) | 1 (3) | NS |
| AMR, n(%) | 27 (20) | 22 (59) | <0.01 |
| Plasma cells, n(%) | 10 (7) | 20 (54) | <0.01 |
| ATG treatment, n(%) | 55 (40) | 29 (78) | <0.01 |
| DSA+ n(%) | 73 (54) | 30 (81) | <0.01 |

To cite this abstract in AMA style:
Patel S, Kuten S, Everett J, Loucks-DeVos J, Gaber L, Gaber A, Knight R. Characteristics and Consequences of Renal Allograft Rejections Due to Nonadherence [abstract]. Am J Transplant. 2015; 15 (suppl 3). https://atcmeetingabstracts.com/abstract/characteristics-and-consequences-of-renal-allograft-rejections-due-to-nonadherence/. Accessed February 9, 2026.« Back to 2015 American Transplant Congress
