A Kidney Waitlist Outcomes Timeline to Visualize Candidate Offers and Outcomes
1Hennepin Healthcare Research Institute / University of Minnesota (UMN), Minneapolis, MN, 2Chronic Disease Research Group, Minneapolis, MN, 3Department of Surgery, UMN, Minneapolis, MN, 4Hennepin Healthcare / UMN, Minneapolis, MN, 5Scientific Registry of Transplant Recipients, Minneapolis, MN
Meeting: 2021 American Transplant Congress
Abstract number: 860
Keywords: Kidney transplantation, Monitoring, Waiting lists
Topic: Clinical Science » Kidney » Kidney Deceased Donor Selection
Session Information
Session Name: Kidney Deceased Donor Selection
Session Type: Poster Abstract
Session Date & Time: None. Available on demand.
Location: Virtual
*Purpose: While transplant centers closely monitor posttransplant outcomes for each transplant recipient, centers currently lack data to monitor waitlist outcomes of individual candidates. Candidates who are waiting may receive multiple deceased donor organ offers. Centers may decline offers on behalf of the candidate in order to wait for a better offer. These decisions may impact waitlist outcomes because a better offer may not arrive, and dialysis-related morbidity may worsen. We sought to develop waitlist outcomes reports to facilitate monitoring of candidates who are receiving donor offers.
*Methods: Multiple report mockups were developed using patient-level data from the Scientific Registry of Transplant Recipients (SRTR). Data included a deidentified random sample of 200 kidney waitlist candidates from across the US who had received at least one offer between May 7, 2019 and May 6, 2020. For each candidate, offers were identified from match runs from January 1, 2014 to May 6, 2020. Match run data included any offer that was ultimately accepted somewhere and resulted in a transplant. Mockups excluded candidates with multiple listings.
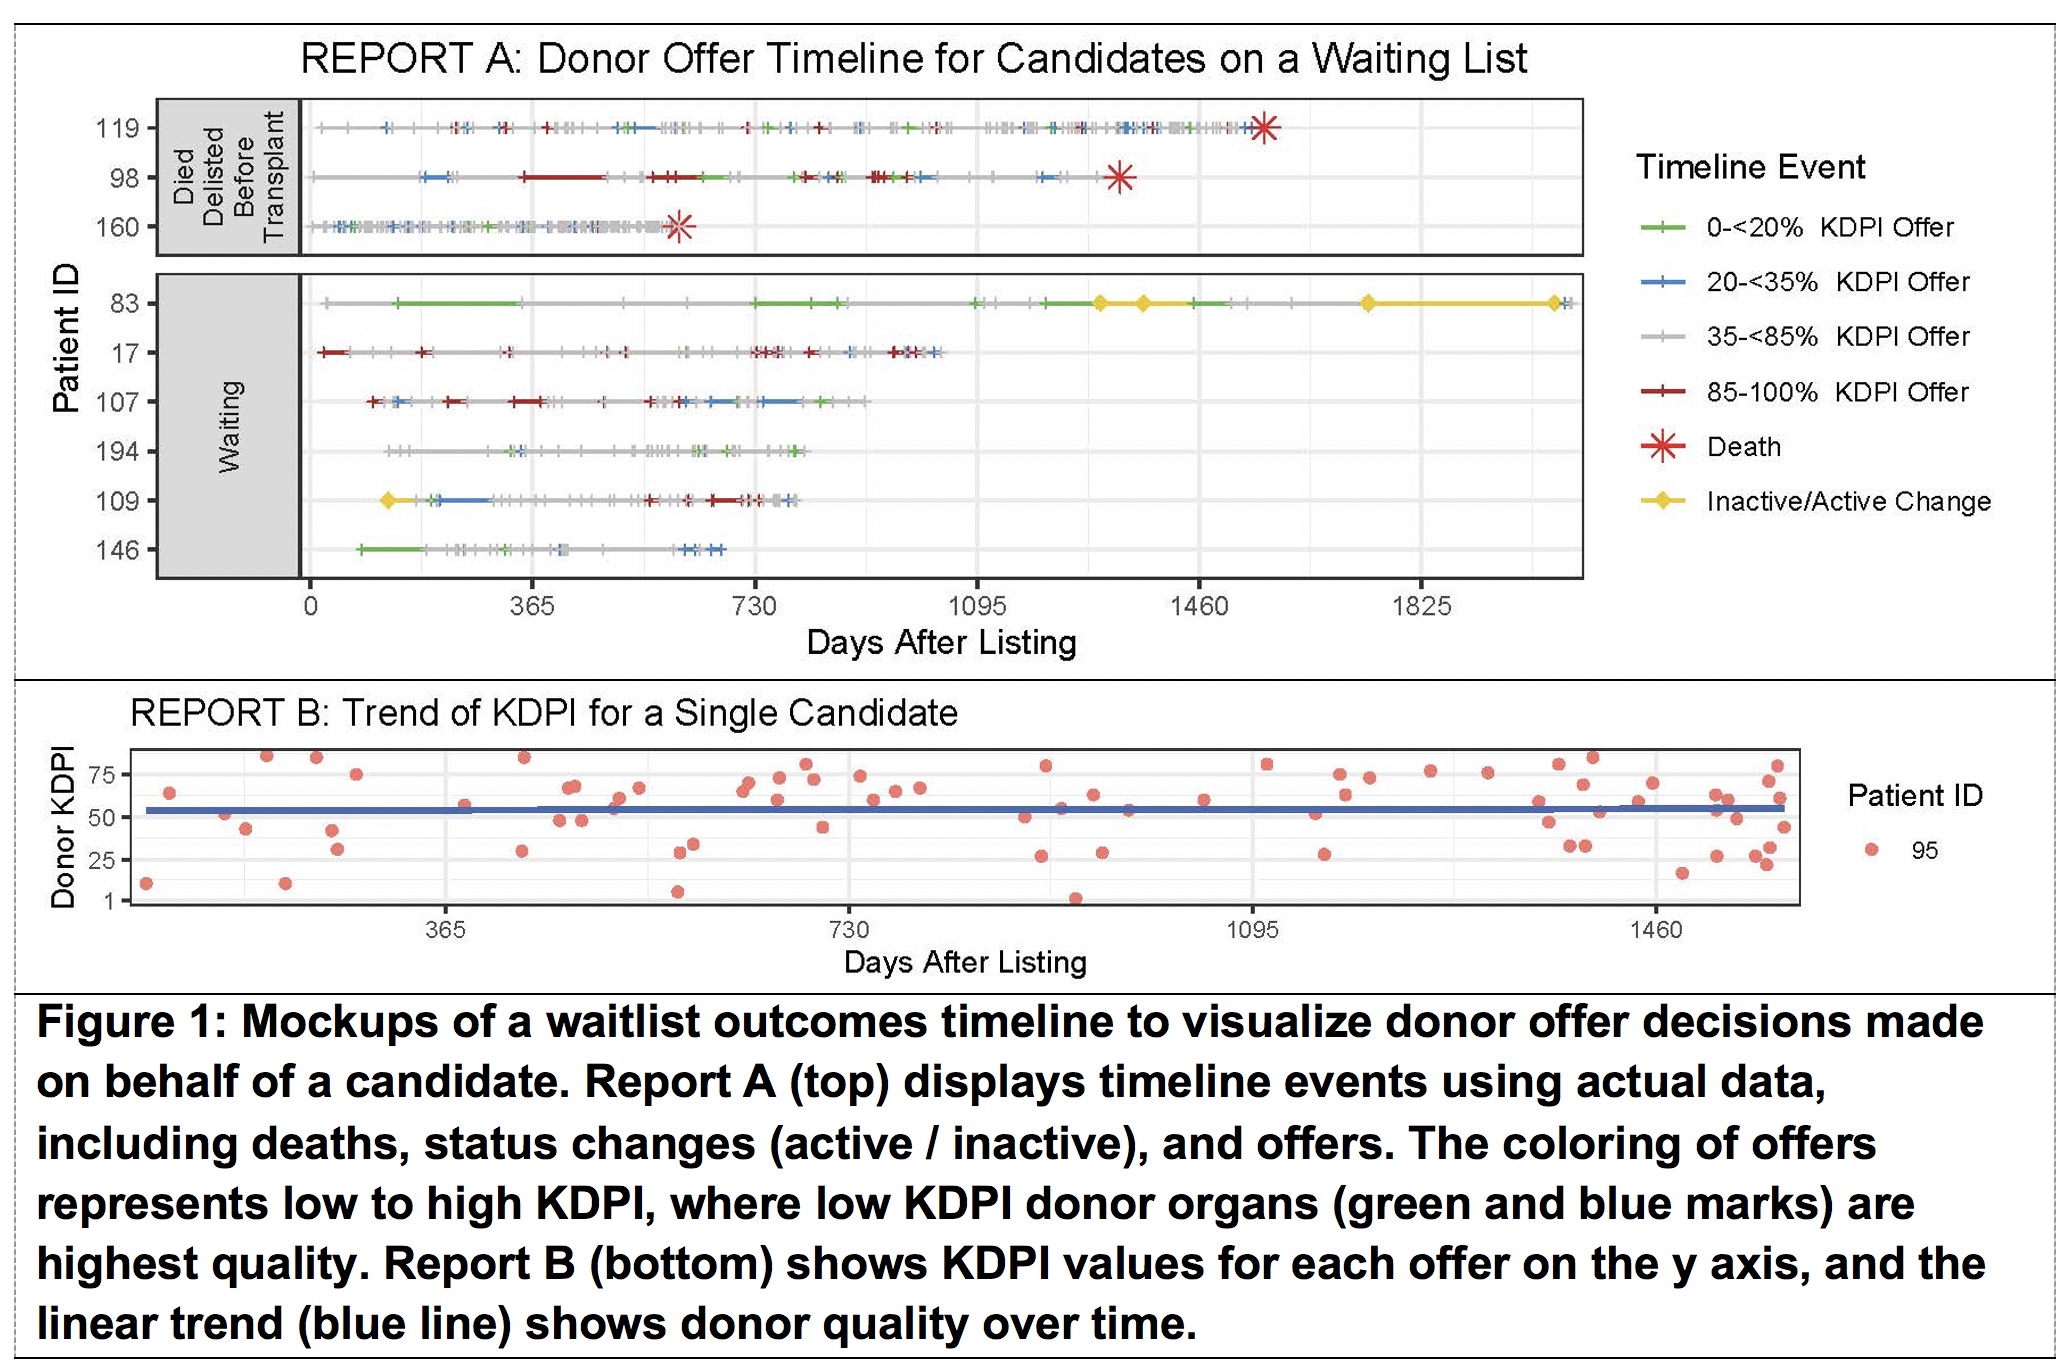
*Results: Reports were designed to visually identify several outcomes: candidates who had died after receiving offers, additional time on dialysis for candidates receiving offers, and changes to quality and frequency of donor offers over time. Figure 1A depicts multiple patients on a waitlist. Each horizontal line represents one candidate and each mark represents an offer to the candidate. Figure 1B depicts an alternative report showing a single candidate who was an example of offer Kidney Donor Profile Index (KDPI) not improving over time.
*Conclusions: The waitlist reports are a potential method for centers to self-monitor candidates and may supplement posttransplant outcomes monitoring and existing decision support tools, such as statistical outcomes calculators. The reports illustrate how offer frequency and KDPI change while candidates wait and the dialysis burden faced by candidates. Future stakeholder feedback will inform improvements and alternatives to reports and identify additional relevant candidate and donor data (e.g. offer number). Additional research is warranted to understand the utility of a visual representation of the impact of offer decisions made on behalf of waitlist candidates.
To cite this abstract in AMA style:
Schaffhausen C, Miller J, Matas A, Israni A, Wey A, Hart A. A Kidney Waitlist Outcomes Timeline to Visualize Candidate Offers and Outcomes [abstract]. Am J Transplant. 2021; 21 (suppl 3). https://atcmeetingabstracts.com/abstract/a-kidney-waitlist-outcomes-timeline-to-visualize-candidate-offers-and-outcomes/. Accessed July 5, 2025.« Back to 2021 American Transplant Congress

