What’s in a High Dose? An Analysis of Tacrolimus Pharmacokinetic Parameters in Rapid Metabolizers
1University of Illinois, Chicago, Chicago, IL, 2Vidant Medical Center, Greenville, NC, 3Veloxis Pharmaceuticals Inc., Cary, NC, 4Johns Hopkins University School of Medicine, Baltimore, MD
Meeting: 2019 American Transplant Congress
Abstract number: 109
Keywords: African-American, Gene polymorphism, Immunosuppression, Kidney transplantation
Session Information
Session Name: Concurrent Session: Kidney Immunosuppression: Novel Regimens and Drug Minimization I
Session Type: Concurrent Session
Date: Sunday, June 2, 2019
Session Time: 4:30pm-6:00pm
 Presentation Time: 5:42pm-5:54pm
Location: Veterans Auditorium
*Purpose: CYP3A5*1 expressers exhibit differences in immediate-release tacrolimus (IR-Tac) PK and require higher doses of IR-Tac to maintain therapeutic trough concentrations. LCP-Tacrolimus (LCPT) demonstrates a unique PK profile which is preserved in CYP3A5*1 expressers. The purpose of this analysis is to explore subject-level tacrolimus dosing and PK parameters in a cohort CYP3A5*1 expressers on IR-Tac vs LCPT.
*Methods: This was a post-hoc analysis of 35 CYP3A5*1 expressers enrolled in a prospective, randomized, crossover-design study who underwent 24-hour PK profiling. All patients received both IR-Tac and LCPT and were on stable IR-Tac doses and formulations at enrollment. Conversion to LCPT occurred at 0.85 of the total daily IR-Tac dose.
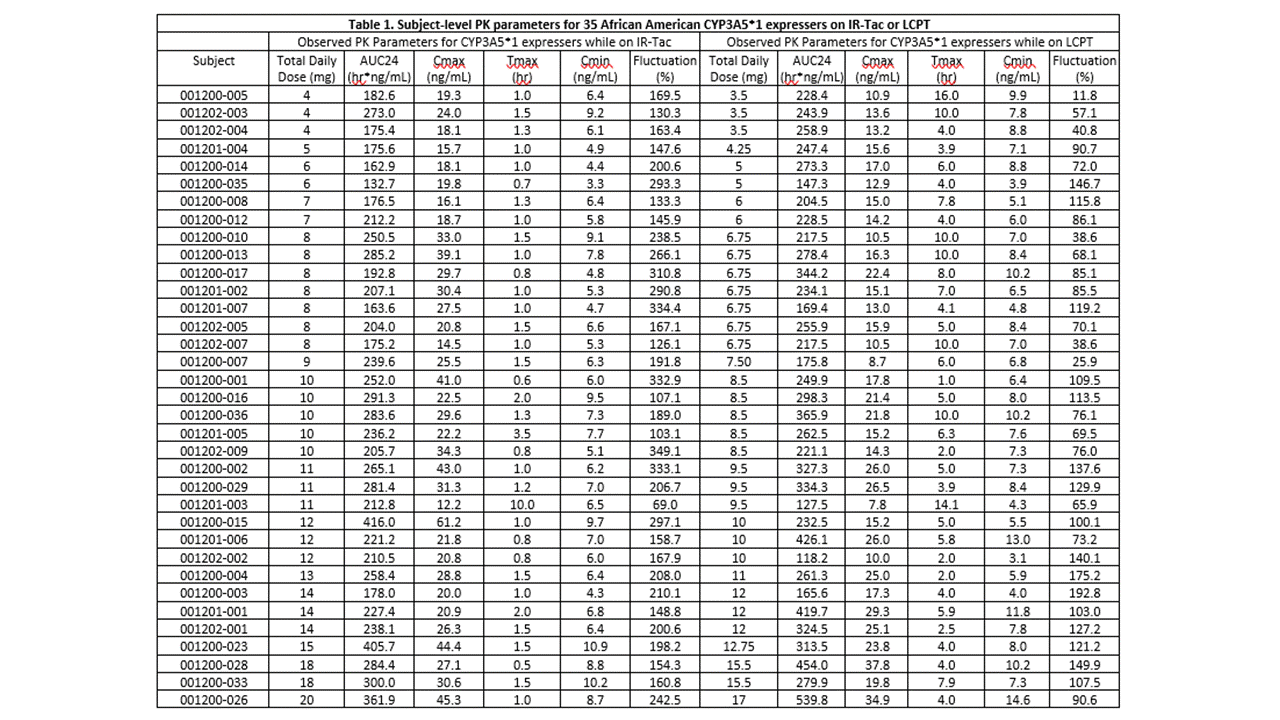
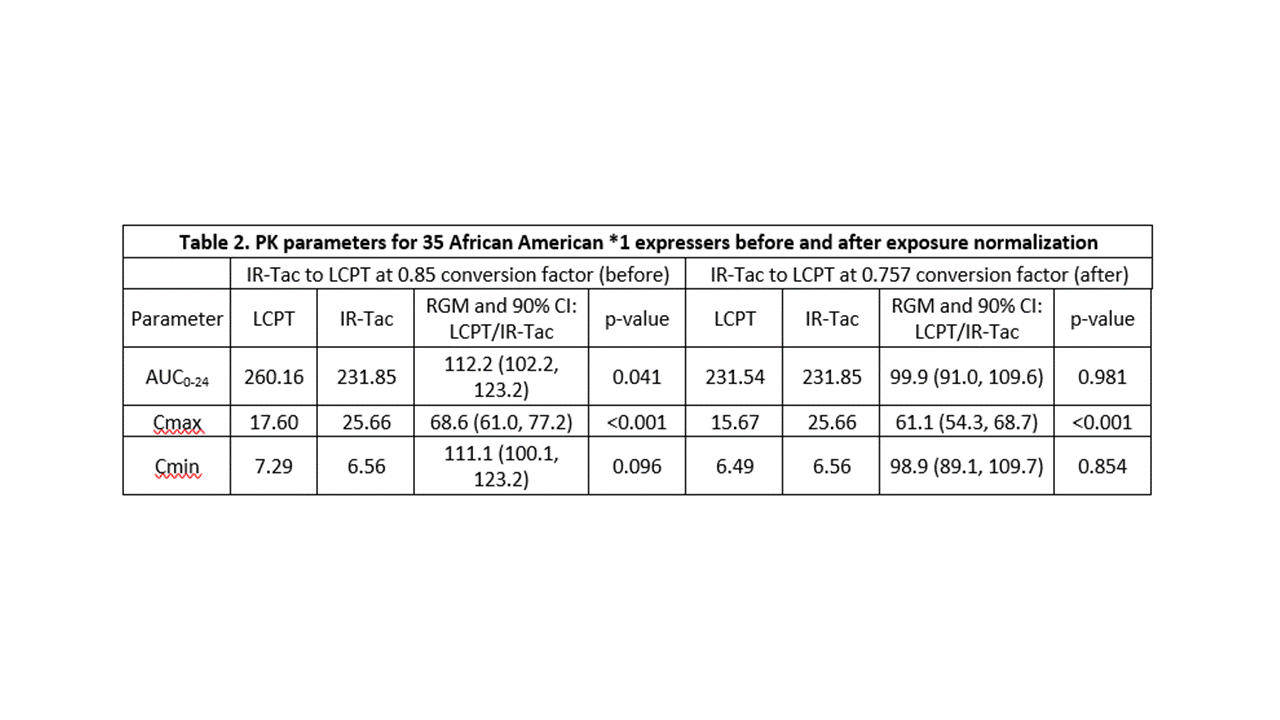
*Results: The cohort had a mean age of 48.5 years and consisted primarily of deceased donor (74%) recipients at an average of 19 (range, 7 to 124) months post-transplant. Twelve (34%) recipients were homozygous for the CYP3A5*1 and the remaining 23 (66%) heterozygous. Doses of IR-Tac ranged from 4 to 20 mg/day, with peak concentrations ranging from 12.2 to 61.2 ng/mL (Table 1). Doses of LCPT ranged from 3.5 to 17 mg/day with peak levels ranging 7.8 to 37.8 ng/mL. At the 0.85 dose conversion factor, tacrolimus AUC0-24 was, on average, 12.2% higher for LCPT compared to IR-Tac (p=0.04; Table 2). Despite this, average Cmax was still 31% lower for LCPT (Table 2). An exposure-normalized analysis to model PK indicated that a conversion factor of 0.757 would have achieved equivalent AUC0-24. The normalized model revealed an even greater difference in Cmax, with LCPT demonstrating a 39% lower Cmax at equivalent exposure.
*Conclusions: Subject-level PK parameters on IR-Tac and LCPT may help inform providers of the impact of conversion to LCPT on specific PK parameters of interest. Overall, conversion to LCPT resulted in reduced peak tacrolimus concentrations and fluctuation as well as lower total daily doses due to the increased bioavailability and unique PK profile which have been well established in kidney transplant recipients.
To cite this abstract in AMA style:
West-Thielke P, Maldonado A, Patel SJ, Stevens DR, Meier-Kriesche U, Brennan D. What’s in a High Dose? An Analysis of Tacrolimus Pharmacokinetic Parameters in Rapid Metabolizers [abstract]. Am J Transplant. 2019; 19 (suppl 3). https://atcmeetingabstracts.com/abstract/whats-in-a-high-dose-an-analysis-of-tacrolimus-pharmacokinetic-parameters-in-rapid-metabolizers/. Accessed February 8, 2026.« Back to 2019 American Transplant Congress


