A Novel, Dose-Adjusted Tacrolimus Intrapatient Variability Model Identifies High-Risk Kidney Transplant Recipients Better Than Existing Methodologies
Astellas Pharma Global Development, Inc., Northbrook.
Meeting: 2018 American Transplant Congress
Abstract number: D97
Keywords: Kidney transplantation, Methodology, Outcome, Prediction models
Session Information
Session Name: Poster Session D: Kidney Complications: Late Graft Failure
Session Type: Poster Session
Date: Tuesday, June 5, 2018
Session Time: 6:00pm-7:00pm
 Presentation Time: 6:00pm-7:00pm
Location: Hall 4EF
Intrapatient variability (IPV) of tacrolimus trough concentration (TTC) is a risk factor for inferior transplant outcomes. However, assessing IPV is problematic, relying on fixed dose assumptions and/or linear statistical models. A recently developed dose-adjusted TTC model utilizes nonparametric, functional regression and functional principal component analysis to avoid these pitfalls and fully account for TTC changes over time. We compared IPV estimates using this new approach with those from existing methodologies to identify patients at risk for poor transplant outcomes.
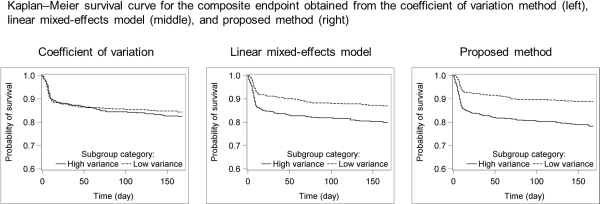
Tacrolimus IPV was estimated from extended-release tacrolimus Phase III study data (N=960) using three models. Patients were assigned to high-variability (HV) and low-variability (LV) groups based on median variance estimated via the dose-adjusted TTC model and two conventional approaches, which estimate IPV using coefficient of variation (CV) and a linear mixed-effects model (LME). Biopsy-confirmed acute rejection (BCAR), graft loss, and composite endpoint (BCAR, graft loss, mortality, or loss to follow-up) were compared between HV and LV groups using Kaplan–Meier and multivariate cox regression methods.
Using the new model, HV patients had 1.79-, 2.89-, and 1.93-fold increased relative risk for BCAR, graft loss, and composite endpoint, respectively, versus LV patients. This model also provided greater discrimination between HV and LV patients than the CV and LME methods for the following: time to graft loss (CV p=0.2141, LME p=0.0027, proposed method p=0.0021), time to BCAR (CV p=0.5726, LME p=0.0258, proposed method p=0.0005), and time to composite endpoint (CV p=0.4976, LME p=0.0020, proposed method p<0.0001) (Figure).
In conclusion, the dose-adjusted TTC model was superior in characterizing the tacrolimus dose–response relationship and improving the estimation of TTC variability versus the CV and LME approaches. Thus, the dose-adjusted TTC model may be a useful adjunct to help identify patients at high risk for untoward transplant outcomes. 
CITATION INFORMATION: Kim J., Wilson S., Song Y., Schwartz J. A Novel, Dose-Adjusted Tacrolimus Intrapatient Variability Model Identifies High-Risk Kidney Transplant Recipients Better Than Existing Methodologies Am J Transplant. 2017;17 (suppl 3).
To cite this abstract in AMA style:
Kim J, Wilson S, Song Y, Schwartz J. A Novel, Dose-Adjusted Tacrolimus Intrapatient Variability Model Identifies High-Risk Kidney Transplant Recipients Better Than Existing Methodologies [abstract]. https://atcmeetingabstracts.com/abstract/a-novel-dose-adjusted-tacrolimus-intrapatient-variability-model-identifies-high-risk-kidney-transplant-recipients-better-than-existing-methodologies/. Accessed January 7, 2026.« Back to 2018 American Transplant Congress
