The Donor Risk Index Does Not Accurately Classify Patients With or Without Graft Failure
1Surgery, TGMG/USF Morsani College of Medicine, Tampa, FL
2Internal Medicine, Morsani College of Medicine, USF, Morsani College of Medicine, Tampa, FL
3Hepatology, TGMG/USF Morsani College of Medicine, Tampa, FL.
Meeting: 2015 American Transplant Congress
Abstract number: C108
Keywords: Donors, Liver, marginal, Outcome, Prediction models
Session Information
Session Name: Poster Session C: Liver Donation and Allocation
Session Type: Poster Session
Date: Monday, May 4, 2015
Session Time: 5:30pm-6:30pm
 Presentation Time: 5:30pm-6:30pm
Location: Exhibit Hall E
In liver transplantation assessing risk of donor is paramount to graft survival. The donor risk index (DRI) was introduced as a predictor of graft failure using donor and transplant characteristics applying a cox regression model. Here, we attempt to validate the DRI using recipient operator characteristics (ROC) analysis.
Methods: The Organ Procurement and Transplant Network database was used for the analysis from January 1, 2003 trough December 31, 2012. Recipient and donor data was collected. Pediatrics and multiple organ transplants were excluded. Cox regression analysis was used to verify previous findings. The area under the ROC curve was used to evaluate accuracy of the DRI at 90 days, 1 year and 3 years. Statistical analysis was done using SAS.
Results: 51,100 adults were transplanted from deceased donors during the study period. Table 1 shows the donor demographic data. Donors age greater than 50 comprised 35% of the donor pool and 60% were male. Stroke was the cause of death in 42% and DCD comprised 6.36%.
| Donor Factor | Frequency | Percent |
| Age | ||
| 0-17 | 3,476 | 6.8 |
| 18-39 | 19,200 | 37.57 |
| 40-49 | 10,102 | 19.77 |
| 50-59 | 10,030 | 19.63 |
| 60-69 | 5,786 | 11.32 |
| +70 | 2,506 | 4.9 |
| Female | 20,771 | 40.65 |
| Race | ||
| African American | 8,442 | 16.52 |
| White | 34,384 | 67.29 |
| Other | 8,258 | 16.16 |
| Unknown | 16 | 0.03 |
| Partial/Split | 387 | 1.33 |
| Cause of Death | ||
| Trauma | 18,826 | 36.84 |
| Stroke | 21,531 | 42.14 |
| Anoxia | 9,416 | 18.43 |
| Other | 1325 | 2.59 |
| Unknown | 2 | 0 |
| DCD | 3,251 | 6.36 |
| Height (cm) | Mean 171.54 |
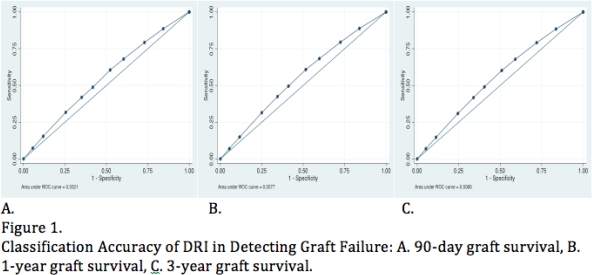
Graft survival frequencies range from 74% to 84% at 3 years. Figure 1 depicts the ROC curves for graft survival at three different time intervals. The area under the ROC curve was for 90-day, 1-year and 3-year was 0.5577, 0.5521, and 0.5580 respectively.
Conclusion: The donor risk index does not accurately discriminate graft failure using ROC analysis. The area under the ROC curve with a value of 0.5 does not have ability to discriminate between graft failure and survival.

To cite this abstract in AMA style:
Franco E, Athanasios T, Kemmer N, Leone L, Alsina A, Djulbegovic B. The Donor Risk Index Does Not Accurately Classify Patients With or Without Graft Failure [abstract]. Am J Transplant. 2015; 15 (suppl 3). https://atcmeetingabstracts.com/abstract/the-donor-risk-index-does-not-accurately-classify-patients-with-or-without-graft-failure/. Accessed January 31, 2026.« Back to 2015 American Transplant Congress
