Wide Geographic Variability in the Proportion of Donors with Cardiac Death – Lost Opportunities for Organ Donation?
1Department of Surgery, University of Pennsylvania, Philadelphia, PA, 2Department of Medicine, University of Pennsylvania, Philadelphia, PA, 3Biostatistics and Epidemiology, University of Pennsylvania, Philadelphia, PA
Meeting: 2019 American Transplant Congress
Abstract number: 356
Keywords: Donors, non-heart-beating, Kidney/liver transplantation, Procurement, Public policy
Session Information
Session Name: Concurrent Session: Non-Organ Specific: Public Policy & Allocation
Session Type: Concurrent Session
Date: Monday, June 3, 2019
Session Time: 4:30pm-6:00pm
 Presentation Time: 5:18pm-5:30pm
Location: Room 311
*Purpose: Donation after cardiac death (DCD) donors are largely not considered by organ procurement organization (OPO) metrics, as DCD donors are only counted in donor conversion metrics if they are used, but otherwise not added to the denominator of potential donors. We aimed to measure the variability in percentage of DCD donors (%DCD) across the 58 donor services areas (DSAs) and whether the %DCD is correlated to underlying supply and demand factors.
*Methods: We augmented UNOS data with CDC death records and SRTR OPO statistics over the study period of 2011-2016 to characterize DSAs. The associations between the outcome of %DCD and DSA-specific variables related to potential donors, OPO performance, waitlist metrics, and center competition were examined using the Spearman’s correlation coefficient (rs).
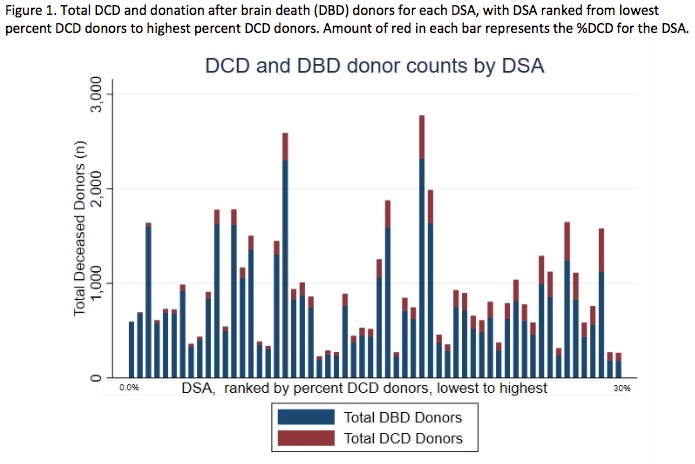
*Results: In a cohort of 52,184 deceased donors, the %DCD varied widely across DSAs, with a median of 15.1% (IQR [9.3%, 20.9%]; range 0.0-32.0%) [Figure 1].
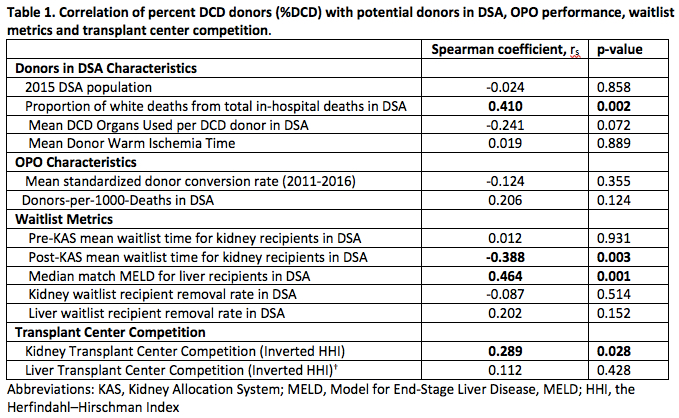
When compared to DSAs with the lowest %DCD, DCD donors from DSAs with the highest %DCD were older (median age [IQR]: 43 [27, 53] vs 36 [23, 48]) more white (89.5% vs 74.8%), and had a higher median kidney donor profile index (54 [33, 75] vs 50 [28, 66]) (all p<0.01). There was moderate negative correlation between %DCD and mean waiting time for kidney recipients (rs=-0.39). There was moderate positive correlation between %DCD and median match MELD (rs=0.46), the proportion of white deaths out of all in-hospital deaths under age 75 (rs= 0.41) and kidney center competition, measured using the Herfindahl-Hirschman Index (rs=0.29). Other DSA-specific factors were not or weakly correlated with %DCD, (rs<0.25) [Table 1].
Adjusting for correlated variables in linear regression explained only 49% of the variability in %DCD.
*Conclusions: Common measures of potential donor pool, market competition, and ‘need’ for donor organs of explain only a portion of the variability in DCD. This undue variability requires further study to understand opportunities to increase the donor pool.
To cite this abstract in AMA style:
Sonnenberg EM, Goldberg DS, Hsu JY, Reese PP, Abt PL. Wide Geographic Variability in the Proportion of Donors with Cardiac Death – Lost Opportunities for Organ Donation? [abstract]. Am J Transplant. 2019; 19 (suppl 3). https://atcmeetingabstracts.com/abstract/wide-geographic-variability-in-the-proportion-of-donors-with-cardiac-death-lost-opportunities-for-organ-donation/. Accessed February 8, 2026.« Back to 2019 American Transplant Congress


