Using Trajectory Analysis to Characterize Trends in OPO Performance with Population-Based Metrics
1Emory University, Emory Transplant Center, Atlanta, GA, 2University of Miami, Miami, FL
Meeting: 2020 American Transplant Congress
Abstract number: 437
Keywords: Donation, Procurement
Session Information
Session Name: All Organs: Public Policy & Allocation
Session Type: Oral Abstract Session
Date: Saturday, May 30, 2020
Session Time: 3:15pm-4:45pm
 Presentation Time: 3:39pm-3:51pm
Location: Virtual
*Purpose: Identifying the organ procurement organizations (OPOs) with the greatest opportunity to improve donation rates may help increase the number of transplants in the United States, a stated priority in the OPTN Strategic Plan. We categorized and described trends in OPO performance over the past 15 years using a standardized, population-based donation metric.
*Methods: Deceased donors from 2003 to 2017 were obtained from publicly available UNOS data. Population death data from the same time period was obtained from the CDC Underlying Cause of Death database. Population deaths were included if they were age 18-74 and from a cause consistent with organ donation (ischemic heart disease, cerebrovascular disease or external causes of morbidity and mortality). Deaths were excluded if they did not occur in an inpatient medical facility. Donation rates were calculated for each OPO using the number of donors as the numerator and the number of population deaths as the numerator. We used group-based trajectory models to identify groups of OPOs following a similar pattern in donation rates over time.
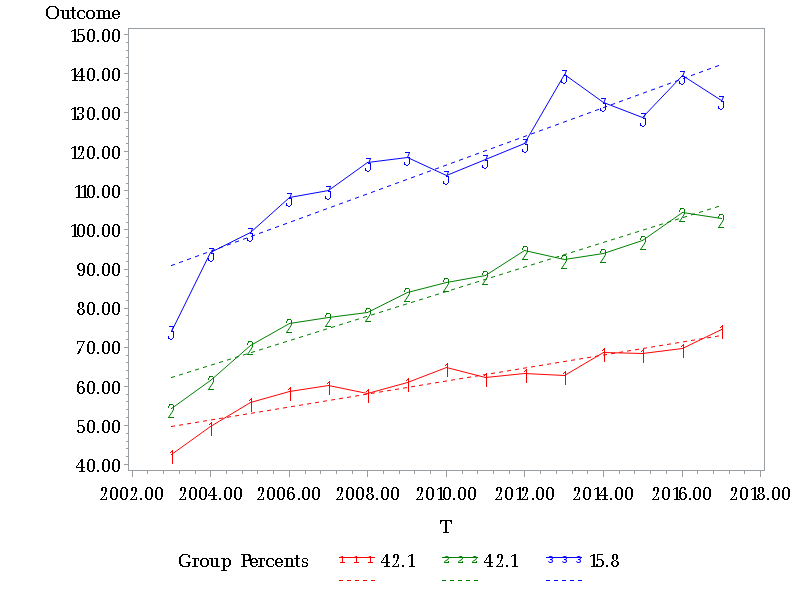
*Results: Three distinct groups were identified (Figure 1). The first group comprises 42.1% of OPOs and is characterized by a low initial donation rate followed by slow increases between 2003 and 2017 (average annual increase: 1.7 per 1,000 deaths). The second group also comprises 42.1% of OPOs, with a higher initial donation rate and a higher annual increase than Group 1 (3.2 per 1,000 deaths). The third group comprises 15.8% of OPOs and is characterized by a much higher initial donation rate than the previous two groups, with a similar annual increase to Group 2 (3.7 per 1,000 deaths). If Group 1 OPOs had the same rate of change as Group 2 or Group 3 OPOs, there could have been 5,933 or 7,910 more donors over the time period, respectively.
*Conclusions: We identified distinct trajectories of change in OPO-level donation rates between 2003 and 2017. Nearly half (42%) of OPOs had slow improvement in donation rates over this time period and may be good targets of intervention to increase donation and maximize organ supply. Further research to identify factors that influence OPO-level donation rates is needed.
To cite this abstract in AMA style:
Ross K, Goldberg D, Lynch R. Using Trajectory Analysis to Characterize Trends in OPO Performance with Population-Based Metrics [abstract]. Am J Transplant. 2020; 20 (suppl 3). https://atcmeetingabstracts.com/abstract/using-trajectory-analysis-to-characterize-trends-in-opo-performance-with-population-based-metrics/. Accessed February 15, 2026.« Back to 2020 American Transplant Congress

