Racial Differences in Transplant and Waitlist Mortality Rates Among HIV+ Kidney Transplant Candidates
J. Locke,1 S. Gustafson,2 C. Durand,3 J. Snyder,2 B. Shelton,1 R. Reed,1 P. MacLennan,1 S. Mehta,1 A. Nellore,1 D. Segev.2,3
1University of Alabama, Birmingham, Birmingham, AL
2SRTR, MMRF, Minneapolis, MN
3Johns Hopkins Univerity, Baltimore, MD.
Meeting: 2015 American Transplant Congress
Abstract number: D270
Keywords: HIV virus, Kidney transplantation, Survival, Waiting lists
Session Information
Session Name: Poster Session D: Viral Infections
Session Type: Poster Session
Date: Tuesday, May 5, 2015
Session Time: 5:30pm-6:30pm
 Presentation Time: 5:30pm-6:30pm
Location: Exhibit Hall E
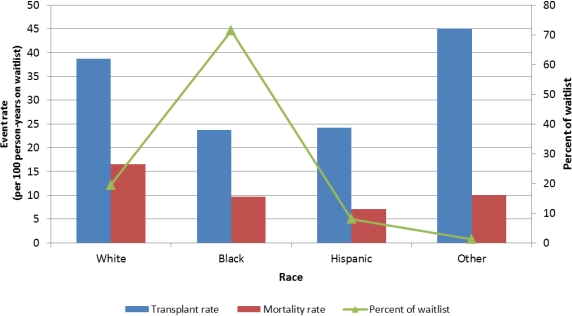
Kidney transplant (KT) is now a viable option for select HIV+ end-stage renal disease patients. As OPTN does not collect HIV status at waitlisting, no study has examined transplant or waitlist mortality rates among HIV+ KT candidates on a national level. IMS pharmacy fills (1/1/01-10/1/12) were linked with SRTR data. KT candidates who filled >1 antiretroviral medication unique to HIV treatment were identified and followed from the time of listing to KT, death, or administrative end of study. Descriptive statistics were used to characterize transplant and mortality rates. During the past decade, median time to transplant among HIV+ candidates decreased from 3.66 to 1.85 years, yet waitlist mortality increased from 6.9 to 17.0 per 100 patient-years (Table). African Americans (AA) comprise 71.4% of HIV+ waitlist candidates, yet compared with white HIV+ candidates, have significantly longer waiting times and lower KT and mortality rates (Figure). White HIV+ candidates have the highest waitlist mortality of any racial group. Over the past decade, waiting times decreased, and waitlist mortality doubled among HIV+ KT candidates. AAs comprise 71.4% of the HIV+ population awaiting KT, yet are less likely to undergo KT than their white HIV+ counterparts. This disparity in access to KT among AA HIV+ candidates warrants further investigation.
| White (N) | AA (N) | Hispanic (N) | Other (N) | |
| Median time to transplant (years) | ||||
| 2001-2004 | 3.6 (31) | 3.8 (194) | 3.5 (22) | 6.1 (2) |
| 2005-2008 | 1.9 (113) | 3.6 (342) | 3.3 (44) | 1.7 (6) |
| 2009-2012 | 1.2 (50) | 2.3 (178) | 1.7 (14) | 0.8 (4) |
| Waitlist mortality rate (per 100 patient-years) | ||||
| 2001-2004 | 6.7 (31) | 7.9 (194) | 1.2 (22) | 0.0 (2) |
| 2005-2008 | 16.6 (113) | 9.2 (342) | 12.1 (44) | 30.5 (6) |
| 2009-2012 | 29.5 (50) | 15.4 (178) | 5.6 (14) | 0.0 (4) |

To cite this abstract in AMA style:
Locke J, Gustafson S, Durand C, Snyder J, Shelton B, Reed R, MacLennan P, Mehta S, Nellore A, Segev D. Racial Differences in Transplant and Waitlist Mortality Rates Among HIV+ Kidney Transplant Candidates [abstract]. Am J Transplant. 2015; 15 (suppl 3). https://atcmeetingabstracts.com/abstract/racial-differences-in-transplant-and-waitlist-mortality-rates-among-hiv-kidney-transplant-candidates/. Accessed February 14, 2026.« Back to 2015 American Transplant Congress
