Investigating Geographic Variation in the Number of Deceased Donor Transplants Performed in the U.S.
UNOS, Richmond, VA.
Meeting: 2016 American Transplant Congress
Abstract number: 387
Keywords: Donation, Public policy
Session Information
Session Name: Concurrent Session: Disparities in Transplant Access and Outcomes
Session Type: Concurrent Session
Date: Tuesday, June 14, 2016
Session Time: 2:30pm-4:00pm
 Presentation Time: 3:06pm-3:18pm
Location: Room 312
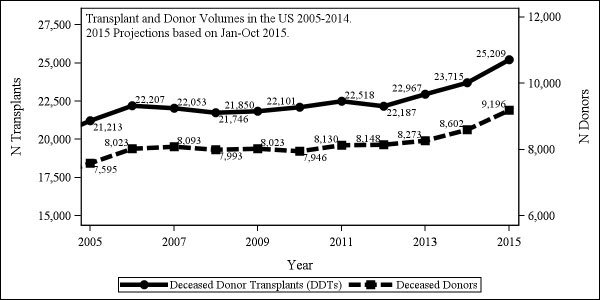
Background: In 2014 the number of deceased donor transplants (DDT) increased greatly compared to the period from 2005 to 2013 when there were minimal changes in deceased donor transplants. We investigated geographic variation in deceased donor transplants, causes of death (COD), and the use of donation after cardiac death (DCD) donors across all organ types.
Methods: Using OPTN data, transplant volumes were assessed by UNOS. The distribution of transplants by donor factors were tested to assess changes. The average number of deceased donors and DDTs for 2014-2015 were compared to the average volume during 2005-2013 to see where increases occurred.
Results: From 2005-2013 DDT volume in the US stayed between 21,213 and 22,967 annually (Fig 1). In 2014, DDTs eclipsed 23,000 for the first time (23,715), a 7.3% increase over the average annual volume from the previous 9 years. Through Oct 2015, the number of DDTs is 20,846, 6.3% higher than 2014 through Oct 2014 and on pace for 25,209 for the year.
All regions besides 2 and 7 have increased average annual volumes of DDTs in 2014-2015 compared to 2005-2013. Regions 4 (24.7%), 5 (19.1%) and 6 (23.0%) had the largest % increases. Regions besides 9 all increased the number of deceased donors recovered annually between these time periods, though region 9 did increase DDTs. Regions 1 (22.3%), 4 (24.4%), 5 (16.9%) and 6 (28.8%) had the largest % increases.
The proportion of donor head trauma as COD has decreased (p<0.01), while anoxia as COD (p<0.01) and cardiovascular and drug intoxication as mechanism of death have increased (p<0.01). DCD donor volume was 16% higher through Oct 2015 vs. 2014, a significant shift in the proportion of total donors (p<0.01).

Conclusions: The recent increases in DDTs after a decade of stagnation has been geographically broad based with increases in most regions. Changes in donor causes and mechanisms of death also help explain the overall rise. Further analysis of these data and center practice changes will be used by the OPTN/UNOS to inform efforts to promote the #1 strategic goal of increasing transplant volume.
CITATION INFORMATION: Carrico R, Stewart D, Ehrensberger R, Shepard B, Klassen D. Investigating Geographic Variation in the Number of Deceased Donor Transplants Performed in the U.S. Am J Transplant. 2016;16 (suppl 3).
To cite this abstract in AMA style:
Carrico R, Stewart D, Ehrensberger R, Shepard B, Klassen D. Investigating Geographic Variation in the Number of Deceased Donor Transplants Performed in the U.S. [abstract]. Am J Transplant. 2016; 16 (suppl 3). https://atcmeetingabstracts.com/abstract/investigating-geographic-variation-in-the-number-of-deceased-donor-transplants-performed-in-the-u-s/. Accessed February 16, 2026.« Back to 2016 American Transplant Congress
