Industry Payments to Transplant Surgeons
Johns Hopkins, Baltimore.
Meeting: 2015 American Transplant Congress
Abstract number: D240
Keywords: Economics
Session Information
Session Name: Poster Session D: Regulatory Issues in Transplant Administration
Session Type: Poster Session
Date: Tuesday, May 5, 2015
Session Time: 5:30pm-6:30pm
 Presentation Time: 5:30pm-6:30pm
Location: Exhibit Hall E
The Open Payments Program (OPP) was implemented to publicly disclose industry payments to physicians, enabling patients to be aware of potential conflicts of interest. Outcomes in organ transplantation have benefited from advances made by the pharmaceutical industry, yet industry payments to transplant surgeons (TS) have not previously been quantified.
METHODS: Using the first wave of OPP data (8/1/13-12/31/13) released on 9/30/14, we calculated industry payments made to TS. We analyzed associations between a TS's h-index (a measure of academic productivity) with robust poisson regression and the chance of receiving industry payments of >$1000 (1K). We used SRTR data to study the association between industry payments & center volume & case mix.
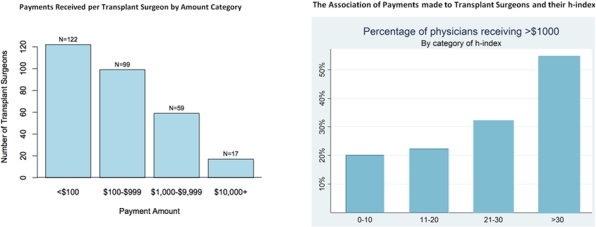
RESULTS: 297 TS received a total of $759,654. TS received a median (IQR) of $125(39-1,018), maximum $83,520. A 10-unit increase in a TS's h-index was associated with 30% higher chance of receiving >$1K (RR=1.181.301.44, p<0.001).  Consulting fees comprised 41% of total payments, made to 36 TS. TS that were paid for consulting had higher h-indices 20 (10-35) vs 9 (3-17), p<0.001. Kidney transplant (KT) & liver transplant (LT) centers that received >$1K had higher center volumes, median (IQR) 130(61-279) vs 34 (14-64), p<0.001. Centers that received payments of >$1K had higher percentage of private insurance/self pay (%PI) patients 43%(39-49) vs 36% (24-43), p<0.001.
| Center Characteristics | Industry Payment | p-value | |||
|---|---|---|---|---|---|
| none | <$1K | > $1K | None vs < $1K | None vs > $1K | |
| All Centers that Performed Kidney (KT) or Liver Transplants (LT) | |||||
| Center N | 116 | 73 | 53 | ||
| Volume (median) | 34 | 66 | 130 | <0.001 | <0.001 |
| %PI | 36 | 35 | 43 | 0.5 | <0.001 |
| KT Centers | |||||
| Center N | 115 | 67 | 53 | ||
| Volume | 29 | 64 | 74 | <0.001 | <0.001 |
| %PI | 33 | 31 | 38 | 0.3 | 0.2 |
| LT Centers | |||||
| Center N | 48 | 44 | 44 | ||
| Volume | 23 | 29 | 59 | 0.07 | <0.001 |
| PI% | 46 | 53 | 56 | 0.1 | 0.01 |
CONCLUSION: TS with higher academic productivity received more payments. The majority of payments were made for consulting. Higher-volume centers had higher total industry payments.
To cite this abstract in AMA style:
Ahmed R, Chow E, Massie A, King E, Orandi B, Bae S, Nicholas L, Lonze B, Segev D. Industry Payments to Transplant Surgeons [abstract]. Am J Transplant. 2015; 15 (suppl 3). https://atcmeetingabstracts.com/abstract/industry-payments-to-transplant-surgeons/. Accessed February 14, 2026.« Back to 2015 American Transplant Congress
