Differences in the Cost of Recovering Organs over Time
1Univ of California-San Francisco, San Francisco, CA, 2Univ of Michigan, Ann Arbor, CA, 3Stanford University, Stanford, CA
Meeting: 2019 American Transplant Congress
Abstract number: D411
Keywords: Procurement, Public policy
Session Information
Session Name: Poster Session D: Late Breaking
Session Type: Poster Session
Date: Tuesday, June 4, 2019
Session Time: 6:00pm-7:00pm
 Presentation Time: 6:00pm-7:00pm
Location: Hall C & D
*Purpose: To report on the level and changes over time in the OPOs’ cost of recovering deceased donor organs (kidneys; livers; hearts; and lungs).
*Methods: Cost reports (CMS 216-94 Form) from 52 Independent OPOs (a practical census) over the 2013-2017 period were assessed to determine the average cost per year for four different organs and to measure the compound rate of change per year in these average costs.
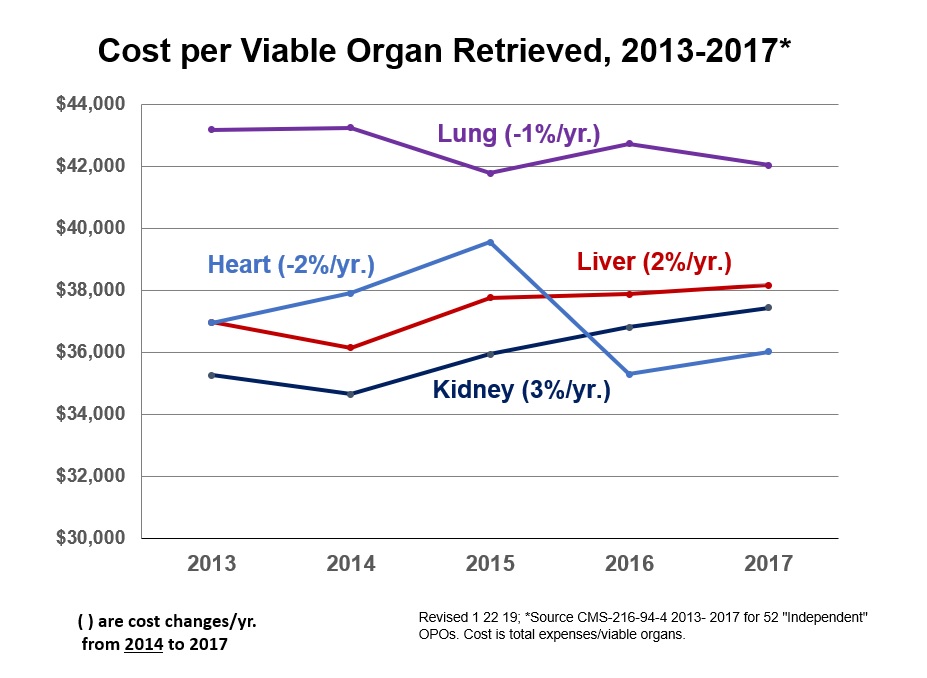
*Results: Overall the 58 OPOs spent $4.6B between 2013 and 2017 on the recovery of four types of deceased donor organs. These four organs (K,L,H,LU) account for 96% of the total of 45,000 DD organs recovered in the US in 2018. Kidneys and livers are the two largest selection of organs recovered and appear to have the most stable reported cost statistics. In 2017 this analysis reports that on average kidneys from OPOs were costing transplant centers $37,400 with livers at about $1,000 higher ($38,200). From 2014 to 2017, kidney cost increases were 3% compounded and livers increases were 2% per year, again compounded. Hearts and lungs are recovered in much smaller numbers with much more variation in the cost in part because some OPOs are in and out of recovering those organs from year to year. In 2017 hearts were costing approximately $36,000 while lungs were on average costing $42,000 although over time these cost estimates are not stable.
*Conclusions: OPO cost reports are a source of national cost data for organ recovery, maybe the only source with such scope and power. The lineup of cost from lowest cost for kidneys, followed by livers, heart, and lungs, appears to fit most preconceptions. The rate of change per year (particularly for kidneys and livers) appears to be modest and similar to the Medical Consumer Price Index that is approximately 3% per year for the 2014 to 2017 period.
To cite this abstract in AMA style:
Roberts JP, Bragg-Gresham J, Held P. Differences in the Cost of Recovering Organs over Time [abstract]. Am J Transplant. 2019; 19 (suppl 3). https://atcmeetingabstracts.com/abstract/differences-in-the-cost-of-recovering-organs-over-time/. Accessed February 9, 2026.« Back to 2019 American Transplant Congress

