Demographic Characteristics of VCA Candidates and Recipients in the U.S.
1Research, UNOS, Richmond, VA, 2Office of the Chief Medical Officer, UNOS, Richmond, VA
Meeting: 2022 American Transplant Congress
Abstract number: 957
Keywords: Waiting lists
Topic: Basic & Clinical Science » Basic & Clinical Science » 20 - VCA
Session Information
Session Time: 7:00pm-8:00pm
 Presentation Time: 7:00pm-8:00pm
Location: Hynes Halls C & D
*Purpose: As with other fields of transplantation, it is important to understand the populations VCA transplantation is serving.
*Methods: This study used OPTN VCA waiting list and transplant data from 7/3/14 to 2/28/21 to characterize 98 VCA candidates and 60 VCA recipients – examining sex, race, age, and SES. We also examined waiting list removal patterns.
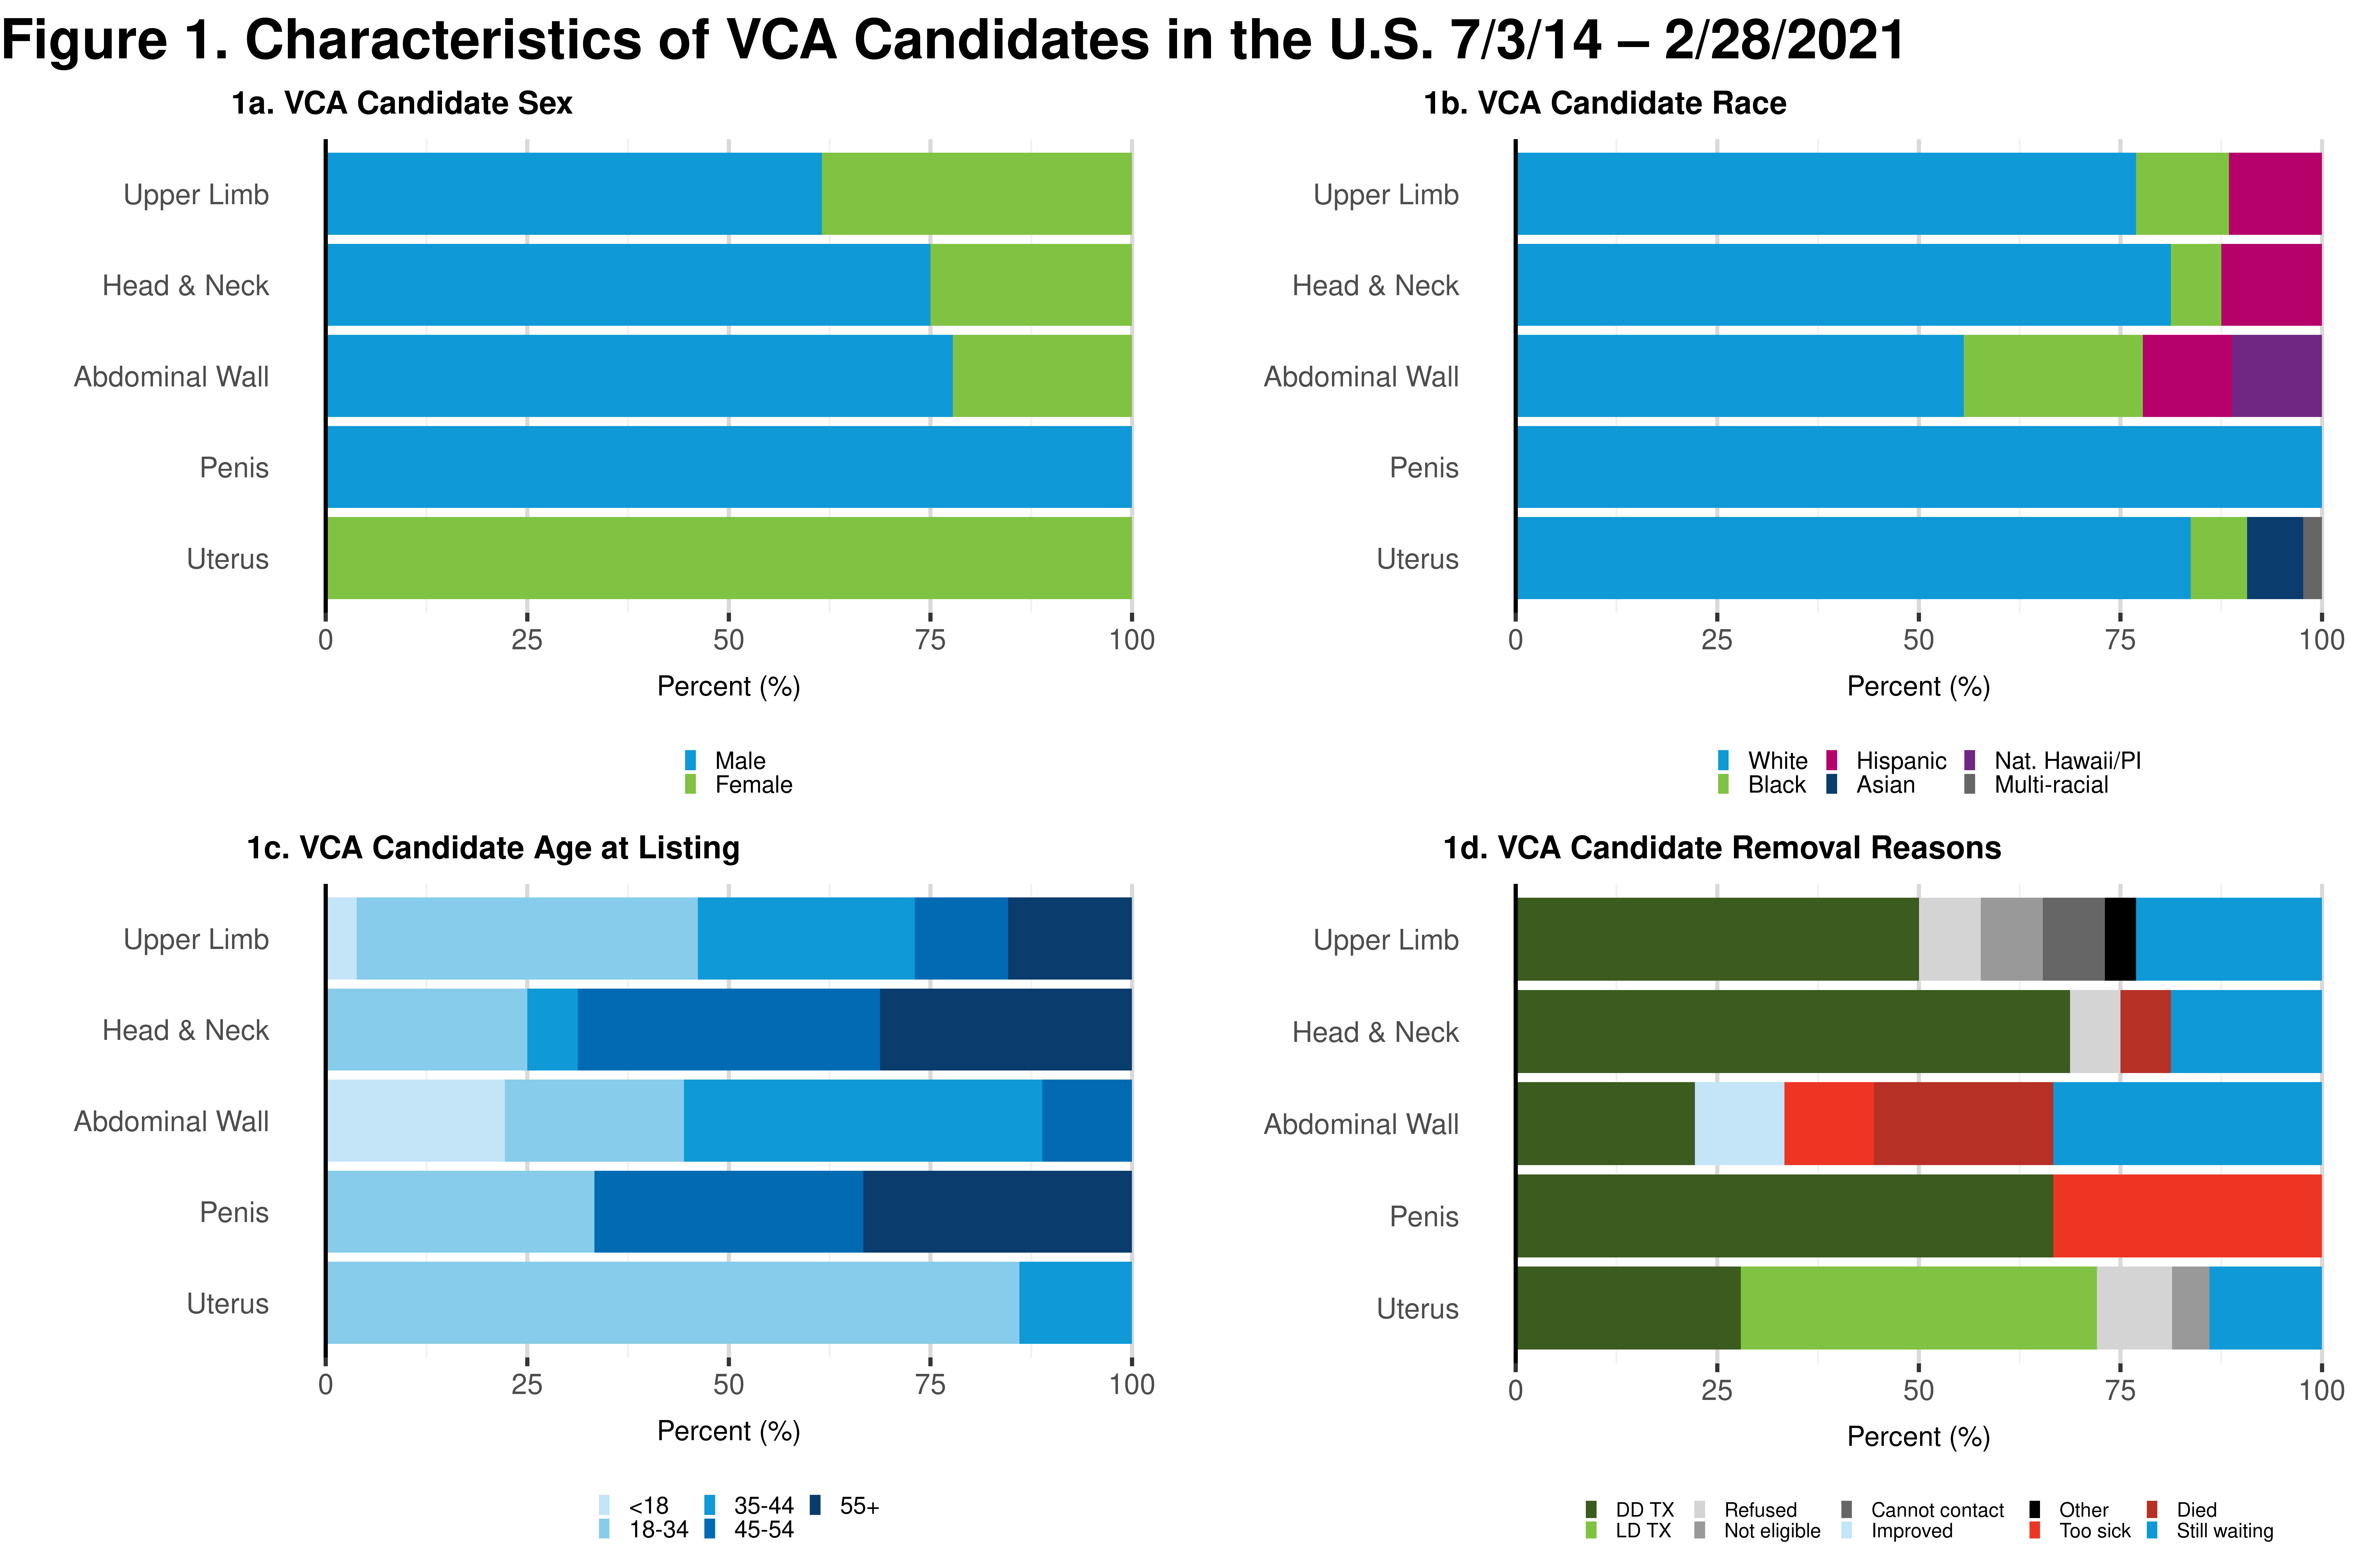
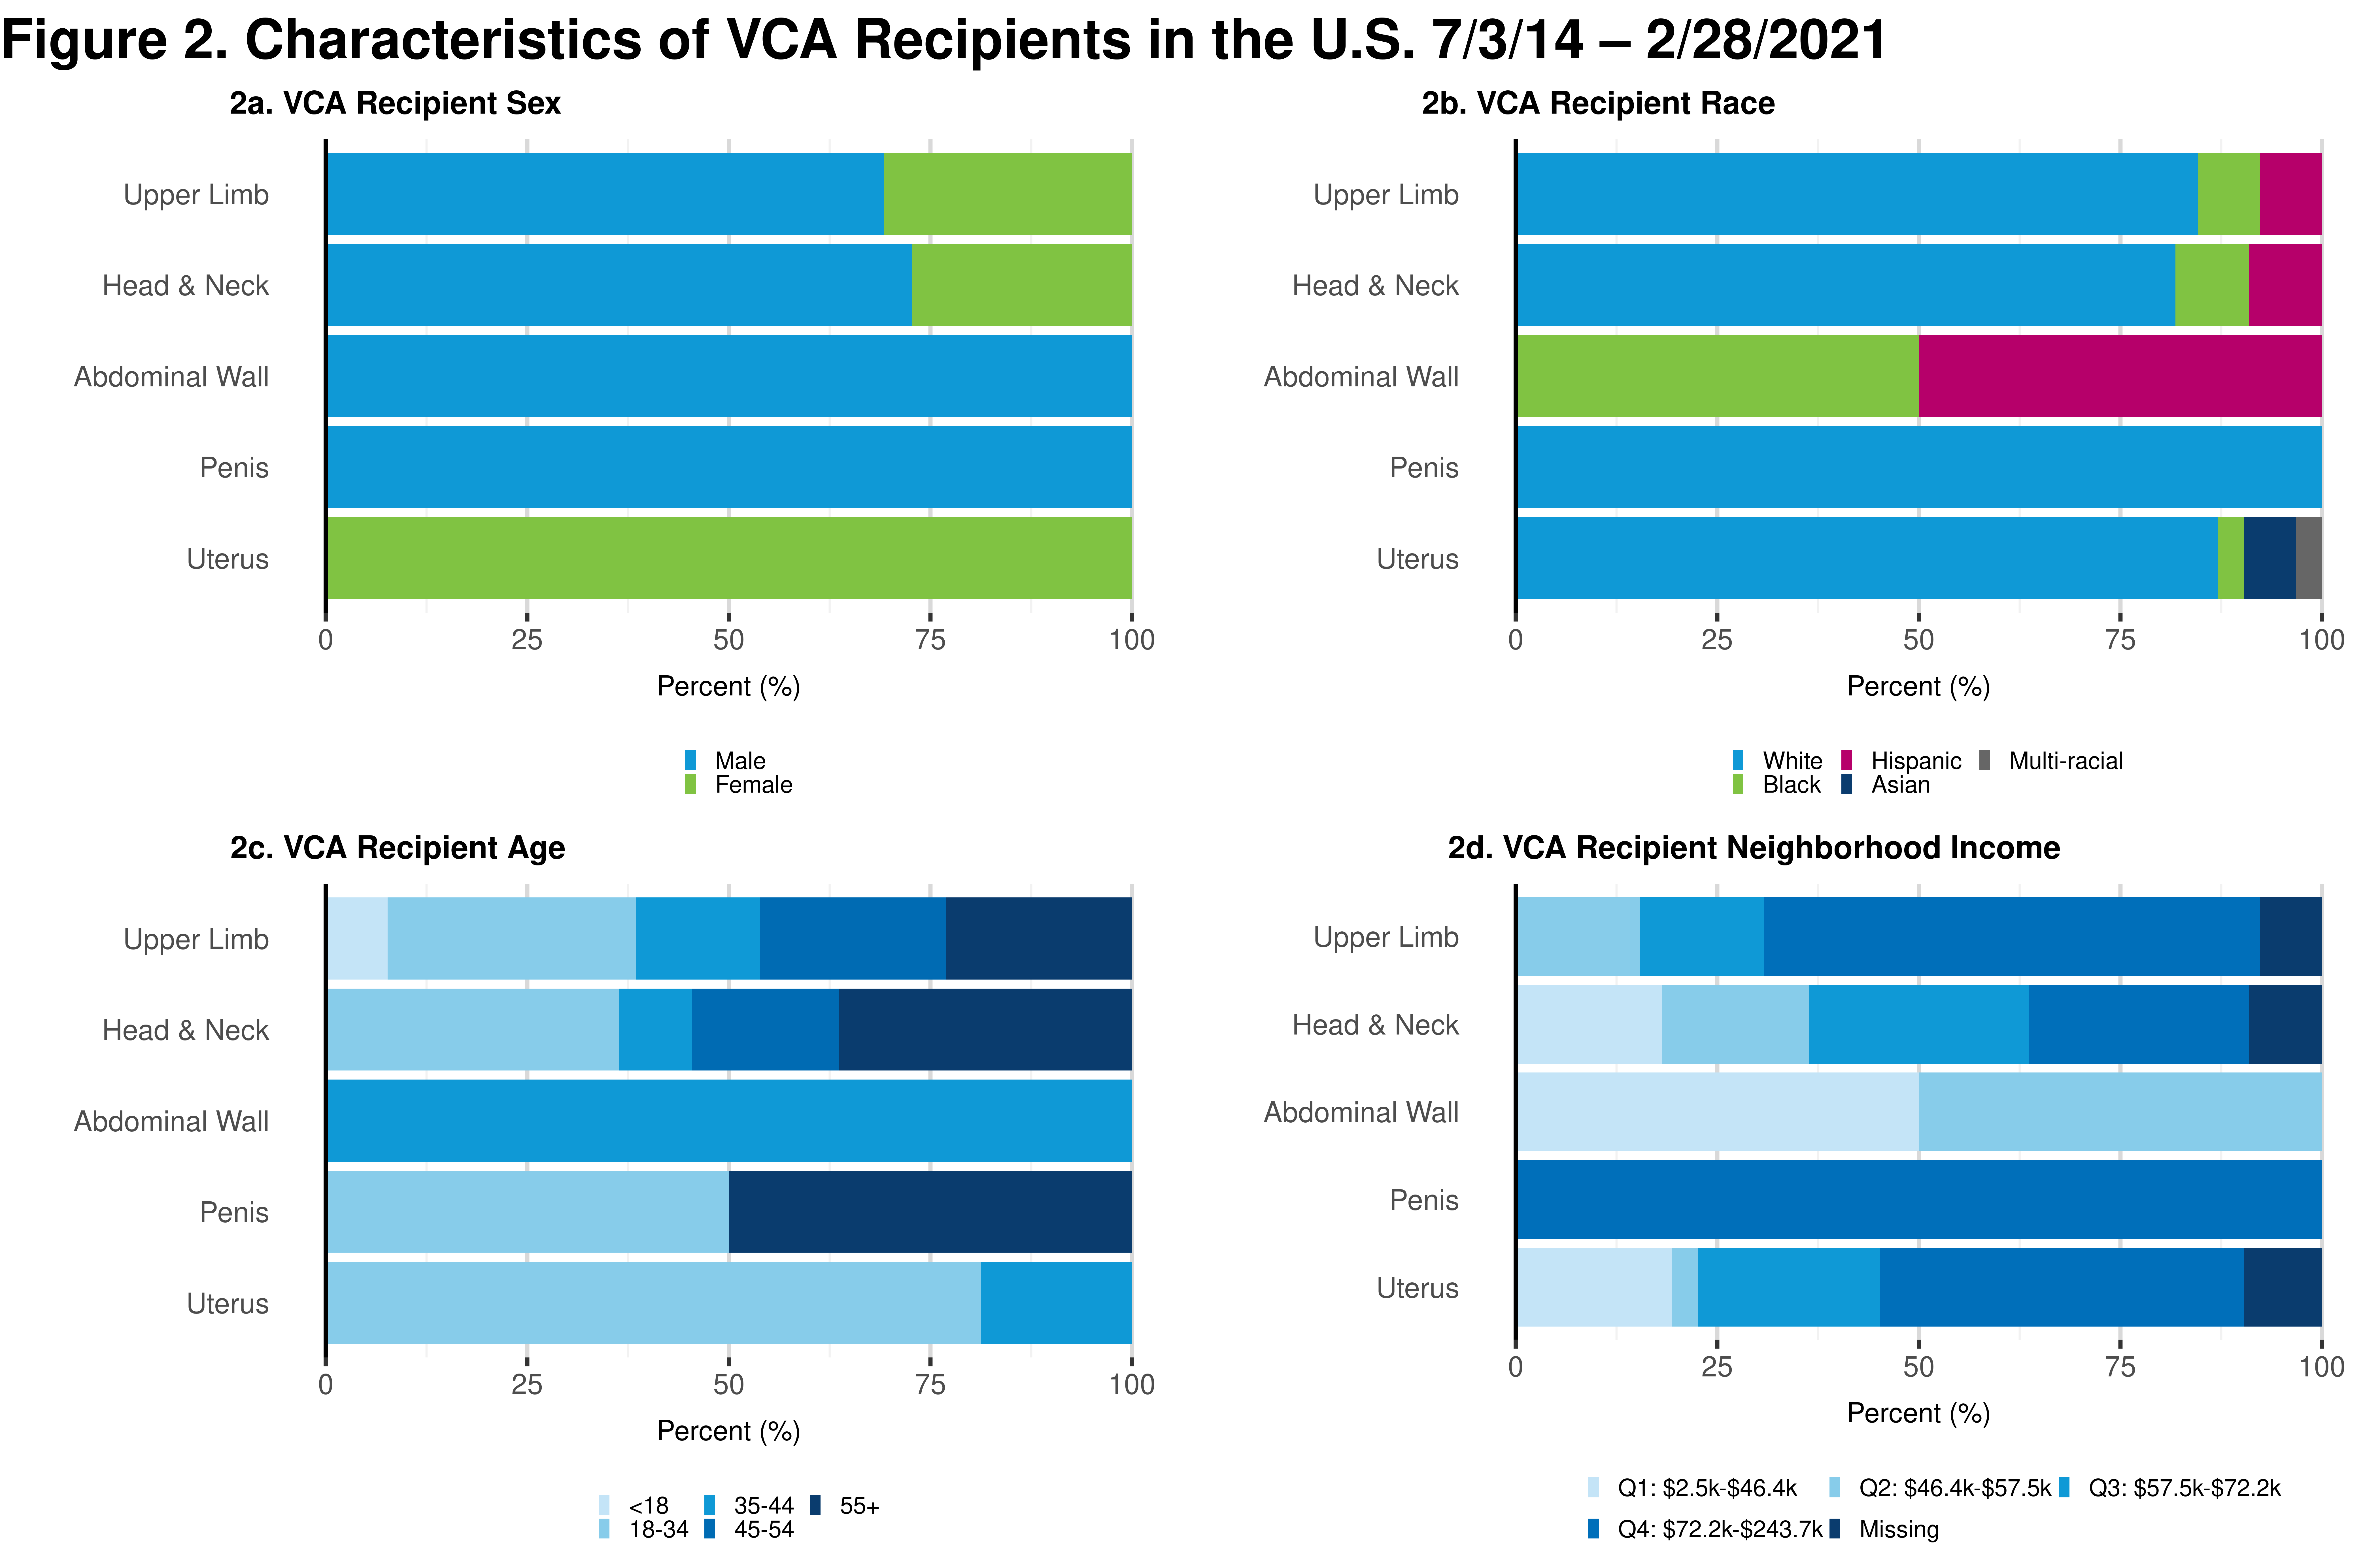
*Results: Between implementation of the OPTN VCA waiting list on 7/3/14 and 2/28/21, the 98 VCA candidates were 60.2% female, 79.6% white, and 78.6% aged 18-44. Of these, 41 received deceased donor transplants (8 bilateral upper limb, 5 unilateral upper limb, 9 face, 1 face with upper limb, 1 scalp, 1 trachea, 2 abdominal wall, 2 penis, and 12 uterus), and 19 received living donor uterus transplants. An additional 20 candidates were removed for other reasons, including three who died and two who were too sick for transplant. VCA recipients were 63.3% female, 83.3% white, 78.3% aged 18-44, and 45.0% from higher income neighborhoods.
*Conclusions: Demographic characteristics of both candidates and recipients varied greatly by specific VCA type. VCA transplantation serves a wide variety of patient populations. Additional monitoring is needed, however, to understand changes in the field and further investigate access to VCA transplantation.
| Upper Limb a | Head & Neck b | Abdominal Wall | Penis | Uterus | Total | |
| n = 26 | n = 16 | n = 9 | n = 3 | n = 43 | N=98 | |
| Sex | ||||||
| Female | 10 (38.5%) | 4 (25%) | 2 (22.2%) | 0 (0%) | 43 (100%) | 59 (60.2%) |
| Male | 16 (61.5%) | 12 (75%) | 7 (77.8%) | 3 (100%) | 0 (0%) | 39 (39.8%) |
| Race | ||||||
| White | 20 (76.9%) | 13 (81.2%) | 5 (55.6%) | 3 (100%) | 36 (83.7%) | 78 (79.6%) |
| Black | 3 (11.5%) | 1 (6.2%) | 2 (22.2%) | 0 (0%) | 3 (7%) | 9 (9.2%) |
| Asian | 0 (0%) | 0 (0%) | 0 (0%) | 0 (0%) | 3 (7%) | 3 (3.1%) |
| Hispanic | 3 (11.5%) | 2 (12.5%) | 1 (11.1%) | 0 (0%) | 0 (0%) | 6 (6.1%) |
| Native Hawaiian/Pacific Islander | 0 (0%) | 0 (0%) | 1 (11.1%) | 0 (0%) | 0 (0%) | 1 (1.0%) |
| Multi-racial | 0 (0%) | 0 (0%) | 0 (0%) | 0 (0%) | 1 (2.3%) | 1 (1.0%) |
| Age | ||||||
| <18 | 1 (3.8%) | 0 (0%) | 2 (22.2%) | 0 (0%) | 0 (0%) | 3 (3.1%) |
| 18-34 | 11 (42.3%) | 4 (25%) | 2 (22.2%) | 1 (33.3%) | 37 (86%) | 56 (57.1%) |
| 35-44 | 7 (26.9%) | 1 (6.2%) | 4 (44.4%) | 0 (0%) | 6 (14%) | 18 (18.4%) |
| 45-54 | 3 (11.5%) | 6 (37.5%) | 1 (11.1%) | 1 (33.3%) | 0 (0%) | 11 (11.2%) |
| 55+ | 4 (15.4%) | 5 (31.2%) | 0 (0%) | 1 (33.3%) | 0 (0%) | 10 (10.2%) |
| Removal Reason | ||||||
| Still waiting | 6 (23.1%) | 3 (18.8%) | 3 (33.3%) | 0 (0%) | 6 (14.0%) | 18 (18.4%) |
| DD transplant | 13 (50%) | 11 (68.8%) | 2 (22.2%) | 2 (66.7%) | 12 (27.9%) | 41 (41.8%) |
| LD transplant | 0 (0%) | 0 (0%) | 0 (0%) | 0 (0%) | 19 (44.2%) | 19 (19.4%) |
| Refused transplant | 2 (7.7%) | 1 (6.2%) | 0 (0%) | 0 (0%) | 4 (9.3%) | 7 (7.1%) |
| No longer eligible | 2 (7.7%) | 0 (0%) | 0 (0%) | 0 (0%) | 2 (4.7%) | 4 (4.1%) |
| Cannot contact | 2 (7.7%) | 0 (0%) | 0 (0%) | 0 (0%) | 0 (0%) | 2 (2.0%) |
| Too sick | 0 (0%) | 0 (0%) | 1 (11.1%) | 1 (33.3%) | 0 (0%) | 2 (2.0%) |
| Died | 0 (0%) | 1 (6.2%) | 2 (22.2%) | 0 (0%) | 0 (0%) | 2 (2.0%) |
| Condition improved | 0 (0%) | 0 (0%) | 1 (11.1%) | 0 (0%) | 0 (0%) | 1 (1.0%) |
| Other | 1 (3.8%) | 0 (0%) | 0 (0%) | 0 (0%) | 0 (0%) | 2 (2.0%) |
| a Upper Limb includes unilateral (n=12) and bilateral (n=14). | ||||||
| b Head and Neck includes face (n=12), scalp (n=1), face with scalp (n=2), and trachea (n=1). | ||||||
| Note: Table excludes 1 bilateral upper limb / face candidate to protect patient privacy. | ||||||
| Upper Limb a | Head & Neck b | Abdominal Wall | Penis | Uterus | Total | |
| n = 13 | n = 11 | n = 2 | n = 2 | n = 31 | N=60 | |
| Sex | ||||||
| Female | 4 (30.8%) | 3 (27.3%) | 0 (0%) | 0 (0%) | 31 (100%) | 38 (63.3%) |
| Male | 9 (69.2%) | 8 (72.7%) | 2 (100%) | 2 (100%) | 0 (0%) | 22 (36.7%) |
| Race | ||||||
| White | 11 (84.6%) | 9 (81.8%) | 0 (0%) | 2 (100%) | 27 (87.1%) | 50 (83.3%) |
| Black | 1 (7.7%) | 1 (9.1%) | 1 (50%) | 0 (0%) | 1 (3.2%) | 4 (6.7%) |
| Asian | 0 (0%) | 0 (0%) | 0 (0%) | 0 (0%) | 2 (6.5%) | 2 (3.3%) |
| Hispanic | 1 (7.7%) | 1 (9.1%) | 1 (50%) | 0 (0%) | 0 (0%) | 3 (5.0%) |
| Multi-racial | 0 (0%) | 0 (0%) | 0 (0%) | 0 (0%) | 1 (3.2%) | 1 (1.7%) |
| Age | ||||||
| <18 | 1 (7.7%) | 0 (0%) | 0 (0%) | 0 (0%) | 0 (0%) | 1 (1.7%) |
| 18-34 | 4 (30.8%) | 4 (36.4%) | 0 (0%) | 1 (50%) | 26 (83.9%) | 36 (60.0%) |
| 35-44 | 2 (15.4%) | 1 (9.1%) | 2 (100%) | 0 (0%) | 5 (16.1%) | 10 (16.7%) |
| 45-54 | 3 (23.1%) | 2 (18.2%) | 0 (0%) | 0 (0%) | 0 (0%) | 5 (8.3%) |
| 55+ | 3 (23.1%) | 4 (36.4%) | 0 (0%) | 1 (50%) | 0 (0%) | 8 (13.3%) |
| Neighborhood Income | ||||||
| Q1: $2,500 – $46,428 | 0 (0%) | 2 (18.2%) | 1 (50%) | 0 (0%) | 6 (19.4%) | 9 (15.0%) |
| Q2: $46,429 – $57,499 | 2 (15.4%) | 2 (18.2%) | 1 (50%) | 0 (0%) | 1 (3.2%) | 6 (10.0%) |
| Q3: $57,500 – $72,227 | 2 (15.4%) | 3 (27.3%) | 0 (0%) | 0 (0%) | 7 (22.6%) | 12 (20.0%) |
| Q4: $72,228 – $243,654 | 8 (61.5%) | 3 (27.3%) | 0 (0%) | 2 (100%) | 14 (45.2%) | 27 (45.0%) |
| Missing | 1 (7.7%) | 1 (9.1%) | 0 (0%) | 0 (0%) | 3 (9.7%) | 6 (10.0%) |
| Payment Source | ||||||
| Free Care | 3 (23.1%) | 5 (45.5%) | 0 (0%) | 1 (50%) | 12 (37.5%) | 21 (35.5%) |
| Donation | 1 (7.7%) | 0 (0%) | 0 (0%) | 0 (0%) | 14 (43.8%) | 15 (25.0%) |
| Private Insurance | 1 (7.7%) | 2 (18.2%) | 0 (0%) | 0 (0%) | 0 (0%) | 3 (5.0%) |
| Medicaid | 1 (7.7%) | 1 (9.1%) | 1 (50%) | 0 (0%) | 0 (0%) | 3 (5.0%) |
| Medicare & Choice | 0 (0%) | 2 (18.2%) | 0 (0%) | 0 (0%) | 0 (0%) | 2 (3.3%) |
| Medicare FFS | 1 (7.7%) | 0 (0%) | 1 (50%) | 0 (0%) | 0 (0%) | 2 (3.3%) |
| Department of VA | 0 (0%) | 0 (0%) | 0 (0%) | 1 (50%) | 0 (0%) | 1 (1.7%) |
| Unknown | 5 (38.5%) | 0 (0%) | 0 (0%) | 0 (0%) | 0 (0%) | 5 (8.3%) |
| Missing | 1 (7.7%) | 1 (9.1%) | 0 (0%) | 0 (0%) | 5 (16.1%) | 8 (13.3%) |
| Diagnosis | ||||||
| Trauma | 6 (46.2%) | 7 (63.6%) | 1 (50%) | 1 (50%) | 1 (3.2%) | 16 (26.7%) |
| Burns | 0 (0%) | 2 (18.2%) | 0 (0%) | 0 (0%) | 0 (0%) | 3 (5.0%) |
| Malignancy | 0 (0%) | 1 (9.1%) | 0 (0%) | 1 (50%) | 0 (0%) | 2 (3.3%) |
| Infection | 7 (53.8%) | 0 (0%) | 1 (50%) | 0 (0%) | 0 (0%) | 8 (13.3%) |
| Infertility | 0 (0%) | 0 (0%) | 0 (0%) | 0 (0%) | 30 (96.8%) | 30 (50.0%) |
| Long segment tracheal stenosis | 0 (0%) | 1 (9.1%) | 0 (0%) | 0 (0%) | 0 (0%) | 1 (1.7%) |
| Days on Waiting List before Transplant | ||||||
| 161.0 (66.0-414.0) | 342.0 (159.0-395.5) | c | c | 193 (77.3-345.3) d | ||
| a Upper Limb includes unilateral (n=5) and bilateral (n=8). | ||||||
| b Head and Neck includes face (n=9), scalp (n=1), and trachea (n=1). | ||||||
| c Cannot be calculated. | ||||||
| d Includes uterus recipients who received deceased donor transplants (n=12). | ||||||
| Note: Table excludes 1 bilateral upper limb / face recipient to protect patient privacy. Missing data reflect data forms not yet submitted. |
To cite this abstract in AMA style:
Wainright J, Cartwright L, Henderson A, Cherikh W, Booker S, Klassen D. Demographic Characteristics of VCA Candidates and Recipients in the U.S. [abstract]. Am J Transplant. 2022; 22 (suppl 3). https://atcmeetingabstracts.com/abstract/demographic-characteristics-of-vca-candidates-and-recipients-in-the-u-s/. Accessed February 9, 2026.« Back to 2022 American Transplant Congress


