The Effect of Changing Candidate Demographics on Living Donor Kidney Transplant Rates
Medicine, University of Virginia, Charlottesville, VA.
Meeting: 2015 American Transplant Congress
Abstract number: C169
Keywords: Donation, Kidney transplantation
Session Information
Session Name: Poster Session C: Living Donor Issues 2
Session Type: Poster Session
Date: Monday, May 4, 2015
Session Time: 5:30pm-6:30pm
 Presentation Time: 5:30pm-6:30pm
Location: Exhibit Hall E
Living donor (LD) rates continue to decline despite a growing list of candidates for renal transplant in the US. While there are many factors driving this we sought to evaluate the extent to which changing demographics of the waitlisted population contributes to decreasing LD rates.
We identified 366 490 unique candidates listed for kidney or kidney pancreas transplant or LD recipients without prior listing between 1996 and 2010 in the SRTR database. We then ran two models, one incorporating age, race/ethnicity, and initial listing status (active vs. inactive) and then a full model including the additional covariates of gender, ABO, PRA, primary insurance, educational status, etiology of kidney disease, dialysis status at listing, multiple listing status, OPO of first listing, and concomitant pancreas listing.
The demographics of the candidate pool changed significantly for age, race/ethnicity, and initial listing status
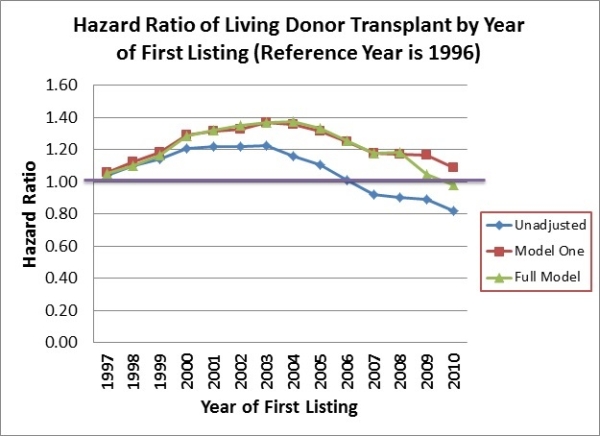
(active vs. inactive). The median age of listing increased from 46 years to 53 years between 1996 and 2010. The proportion of Caucasian candidates decreased from 57.5% to 47.5% over the same period. Inactive listing was rare with a rate under 3% before 2004 when the rules for listing were changed. Subsequent to this, initial inactive listing increased to 30.9%. Figure 1 shows the unadjusted and adjusted hazard ratios (model one and full model) of LD transplantation based on year of first listing. The unadjusted data shows that the LD transplant rate peaked in 2003 and fell in 2006 and thereafter to levels below the rates seen prior to 1997. The fully adjusted model (13 covariates) showed that the LD rate peaked in 2004 and declined in 2010 and thereafter to rates similar to those seen prior to 1997. Model one, including only three covariates for age, race/ethnicity and initial status at listing accounted for almost all the difference seen in the full model.
Changing demographics of the candidate pool explain some, but not all, of the decline in LD rates in the US. 
To cite this abstract in AMA style:
Vranic G, Lucar ANishio, Keith D. The Effect of Changing Candidate Demographics on Living Donor Kidney Transplant Rates [abstract]. Am J Transplant. 2015; 15 (suppl 3). https://atcmeetingabstracts.com/abstract/the-effect-of-changing-candidate-demographics-on-living-donor-kidney-transplant-rates/. Accessed February 3, 2026.« Back to 2015 American Transplant Congress
