How Much Is a Kidney Worth? Comparing Kidney Transplant Strategies in Liver Transplant Candidates.
1Div Nephrology,
2Div Gastroenterology &
Hepatology,
3Ctr Health Policy, Stanford U, Palo Alto
Meeting: 2017 American Transplant Congress
Abstract number: 336
Keywords: Kidney/liver transplantation, Outcome, Prediction models
Session Information
Session Name: Concurrent Session: Health Services and Policy in Organ Transplanation
Session Type: Concurrent Session
Date: Monday, May 1, 2017
Session Time: 4:30pm-6:00pm
 Presentation Time: 5:30pm-5:42pm
Location: E271a
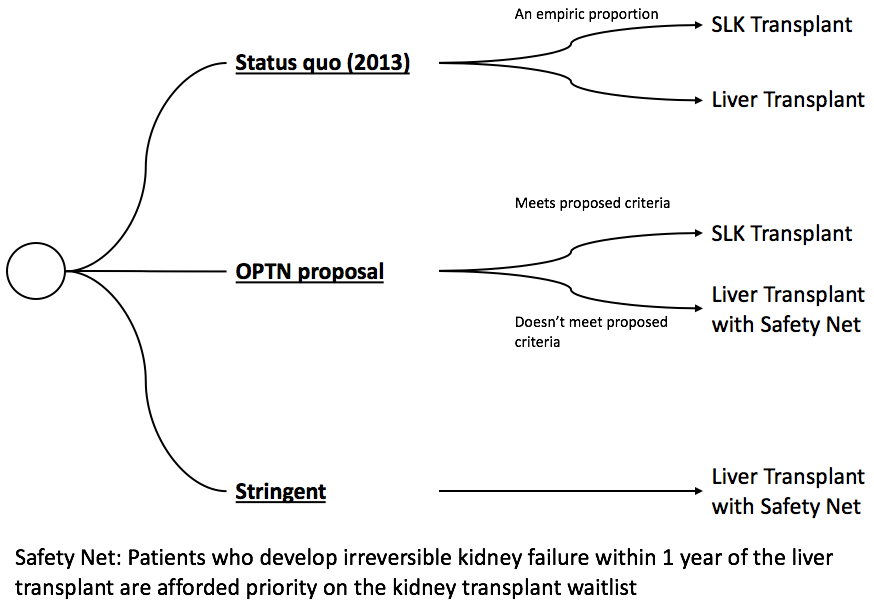
The number of simultaneous liver-kidney (SLK) transplants for renal failure complicating end-stage liver disease (ESLD) is rising. The Organ Procurement and Transplant Network (OPTN) will implement a set of eligibility criteria for SLK transplant. Our aim is to compare three plausible kidney transplant strategies. We built a decision-analytic Markov model (abstract #250370). Assuming Safety Net reduces kidney wait time by 75%, we model patient outcomes by stratum of kidney function at time of transplant: no kidney failure, kidney failure meeting OPTN criteria, and kidney failure not meeting OPTN criteria. 1,000,000 simulations are performed. Outcomes include per-person life-year (LY), quality-adjusted life-year (QALYs), and number of kidneys used by strategy.
The OPTN proposal yields the highest per-person LY and QALY at the expense of higher kidney usage. The converse holds for the stringent strategy (Table1). If we require a gain of 1.2 LYs or fewer per kidney used, then the OPTN proposal is preferred; else the stringent strategy is preferred (Table2). Under no circumstance is the status quo the preferred strategy.
| Outcomes | Status Quo | OPTN Proposal | Stringent |
| Proportion of SLK | 0.02 | 0.06 | 0 |
| LY (years) | 13.05 (13.02-13.07) | 13.10 (13.08-13.12) | 13.02 (13.00-13.04) |
| QALY (years) | 9.67 (9.66-9.69) | 9.72 (9.70-9.74) | 9.66 (9.64-9.67) |
| Number of kidney grafts per person | 0.069 (0.068-0.070) | 0.111 (0.110-0.112) | 0.055 (0.054-0.056) |
| We are willing to allocate a kidney if __ LY is gained | % trials in which strategy is optimal | ||
| Status Quo | OPTN Proposal | Stringent | |
| 0.5 | 14% | 60% | 27% |
| 1.0 | 13% | 49% | 37% |
| 1.5 | 16% | 37% | 47% |
| 2.0 | 13% | 30% | 57% |
We conclude the current kidney allocation policy for liver transplant candidates is due for change. Which of the two alternative strategies ought to be adopted depends on the value we assign to a kidney graft.
CITATION INFORMATION: Cheng X, Kim W, Tan J, Goldhaber-Fiebert J. How Much Is a Kidney Worth? Comparing Kidney Transplant Strategies in Liver Transplant Candidates. Am J Transplant. 2017;17 (suppl 3).
To cite this abstract in AMA style:
Cheng X, Kim W, Tan J, Goldhaber-Fiebert J. How Much Is a Kidney Worth? Comparing Kidney Transplant Strategies in Liver Transplant Candidates. [abstract]. Am J Transplant. 2017; 17 (suppl 3). https://atcmeetingabstracts.com/abstract/how-much-is-a-kidney-worth-comparing-kidney-transplant-strategies-in-liver-transplant-candidates/. Accessed February 18, 2026.« Back to 2017 American Transplant Congress
