Delays in the Live Kidney Donor Evaluation Process.
J. Leanza, K. Kumar, J. Tonascia, E. King, A. Massie, D. Segev.
JHU, Baltimore.
Meeting: 2016 American Transplant Congress
Abstract number: 545
Keywords: Economics, Kidney transplantation
Session Information
Session Name: Concurrent Session: Psychosocial and Treatment Adherence
Session Type: Concurrent Session
Date: Tuesday, June 14, 2016
Session Time: 4:30pm-6:00pm
 Presentation Time: 4:30pm-4:42pm
Location: Room 206
One of the barriers to live kidney donation (LKD) is successful completion of the evaluation process. While it is known that many potential donors (PDs) fail to complete this process, factors associated with delay or failure are poorly understood. We evaluated factors affecting progress through LKD evaluation, with emphasis on socioeconomic status (SES).
METHODS:We followed all PDs free of contraindications to donation between 1/1/2011 and 12/31/2014 through each of five LKD evaluation phases: 1, referral and questionnaire; 2, blood and tissue typing; 3, routine screening and physical exam; 4, evaluation and clearance; 5, donation.
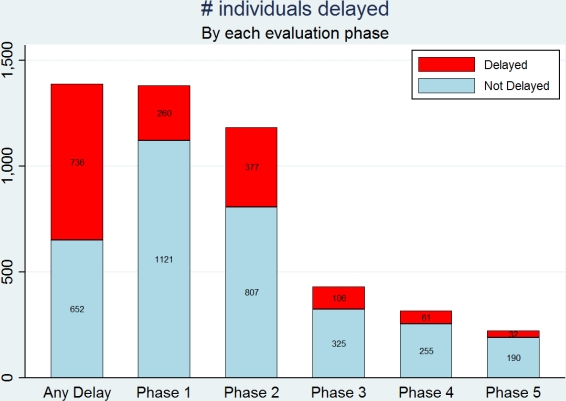
We defined phase-specific ”delay” as ≥90th percentile of time spent by PDs who completed that particular phase (respectively 37, 162, 132, 106, and 307 days) and applied these criteria to all eligible PDs. We built a zip code level SES index–as described by AHRQ–based on crowding, property values, median income, poverty, education, and unemployment. We linked the index by zip code and categorized PDs as “low-SES” (quintiles 1&2) or “high-SES” (quintiles 3-5).
RESULTS:Of 1388 initial PDs, 88.9% completed phase 1, 31.8% phase 2, 23.3% phase 3, 16.6% phase 4, and 13.0% donated (9.8% of all low-SES PDs versus 13.2% of all high-SES PDs). There were 736 total delays. 
After adjusting for race, sex, age, BMI, directed versus non-directed donation type, and biological relatedness between donor and recipient, low-SES PDs had 1.76-fold higher odds of any delay (1.251.762.47 p=0.001), 1.56-fold higher odds of phase 2 delay (1.081.562.25 p=0.018), and 3.22-fold higher odds of phase 5 delay (1.23.228.63 p= 0.02).
|
|
OR of delay for low-SES (vs high-SES) PDs |
|
Any Phase |
1.251.762.47 |
|
Phase 1 |
0.711.071.62 |
|
Phase 2 |
1.081.562.25 |
|
Phase 3 |
0.601.202.44 |
|
Phase 4 |
0.491.233.11 |
|
Phase 5 |
1.203.228.63 |
CONCLUSIONS:A substantial portion of PDs were delayed during the LKD process, particularly those from low-SES zip codes. These PDs also had lower proportions of candidacy and donation. Our findings may encourage investigation into optimizing LDK evaluation and PD support programs, particularly for low-SES PDs.
CITATION INFORMATION: Leanza J, Kumar K, Tonascia J, King E, Massie A, Segev D. Delays in the Live Kidney Donor Evaluation Process. Am J Transplant. 2016;16 (suppl 3).
To cite this abstract in AMA style:
Leanza J, Kumar K, Tonascia J, King E, Massie A, Segev D. Delays in the Live Kidney Donor Evaluation Process. [abstract]. Am J Transplant. 2016; 16 (suppl 3). https://atcmeetingabstracts.com/abstract/delays-in-the-live-kidney-donor-evaluation-process/. Accessed February 17, 2026.« Back to 2016 American Transplant Congress
