Living Kidney Donor Preferences: A Novel Use of a Visual Instrument to Quantify ESRD Risk Acceptance.
C. Thiessen,1 J. Gannon,1 D. Dobosz,1 S. Li,1 D. Gray,2 A. Mussell,2 K. Kennedy,3 L. Skrip,1 E. Gordon,3 P. Reese,2 S. Kulkarni.1
1Yale U, New Haven
2U Pennyslvania, Philadelphia
3Northwestern U, Chicago.
Meeting: 2016 American Transplant Congress
Abstract number: C145
Keywords: Donation, Ethics, Informed consent, Kidney transplantation
Session Information
Session Name: Poster Session C: Kidney Donor Evaluation and Donor Nephrectomy
Session Type: Poster Session
Date: Monday, June 13, 2016
Session Time: 6:00pm-7:00pm
 Presentation Time: 6:00pm-7:00pm
Location: Halls C&D
Background
Given new data about the estimated lifetime risk of ESRD among living kidney donors (LKD) (Muzaale 2014), we elicited their willingness to accept the risk of ESRD (WTA ESRD).
Methods
We conducted a prospective study of adults evaluated as LKDs at 3 centers. We created a 10,000 dot diagram representing a 0-100% chance of ESRD to help LKDs visualize the baseline and post-nephrectomy ESRD risks. LKDs filled in a blank diagram to indicate their maximal WTA ESRD and completed surveys about risk-taking propensity, emotional closeness to their intended recipient, health status, and demographics. Due to a non-normal distribution, WTA ESRD was analyzed in quintiles. Ordinal logistic regression assessed factors associated with WTA ESRD.
Results
Our sample comprised 120 direct and 24 exchange LKDs (85% response rate). Most were white (90%), female (58%), and earned >$65,000/year (54%). They hoped to donate to their friend (23%), sibling (18%), spouse (14%), parent (14%), child (9%), and other (18%). Exchange donors were more likely to be Hispanic (29% v 7%, p=0.004), non-white (33% v 13%, p=0.03), and less close to their recipient (scale 4.9 v 5.8, p=0.02) than direct donors.
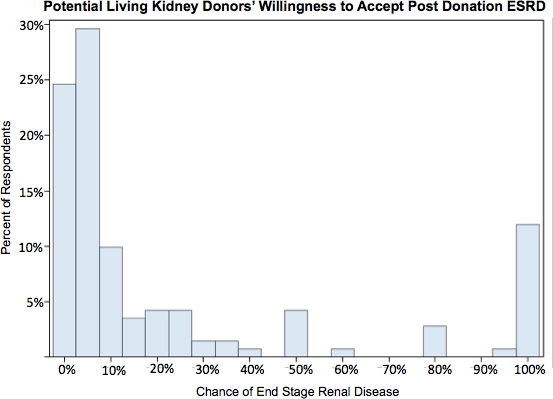
The mean WTA ESRD was 23% (range 0.01-100%), with no difference between direct and exchange donors.  In unadjusted analysis, LKDs with a closer relationship to the recipient (OR 1.4, p<0.001) or a prior LKD evaluation (OR 2.3, p=0.03) had increased WTA ESRD; older LKDs (OR 0.97, p=0.01) reported lower WTA ESRD. Controlling for other factors, only closeness of the donor-recipient relationship (OR 1.33, p=0.04) was associated with increased WTA ESRD.
Conclusion
We found that 95% of potential LKDs are willing to accept a higher risk of ESRD than the newly reported rate of 0.9%. Our results suggest that visual aids can clarify LKD risk attitudes. Given the correlation between donor-recipient relationship and WTA-ESRD, validated instruments to assess this relationship may be a valuable adjunct when considering the risk/benefit calculation used to determine donor candidacy.
CITATION INFORMATION: Thiessen C, Gannon J, Dobosz D, Li S, Gray D, Mussell A, Kennedy K, Skrip L, Gordon E, Reese P, Kulkarni S. Living Kidney Donor Preferences: A Novel Use of a Visual Instrument to Quantify ESRD Risk Acceptance. Am J Transplant. 2016;16 (suppl 3).
To cite this abstract in AMA style:
Thiessen C, Gannon J, Dobosz D, Li S, Gray D, Mussell A, Kennedy K, Skrip L, Gordon E, Reese P, Kulkarni S. Living Kidney Donor Preferences: A Novel Use of a Visual Instrument to Quantify ESRD Risk Acceptance. [abstract]. Am J Transplant. 2016; 16 (suppl 3). https://atcmeetingabstracts.com/abstract/living-kidney-donor-preferences-a-novel-use-of-a-visual-instrument-to-quantify-esrd-risk-acceptance/. Accessed February 1, 2026.« Back to 2016 American Transplant Congress
